
There by the grace of God (& Putin) we go to A$100bn

The Snapshot
- The National Farmers Federation in 2018 set an ambitious target to grow agricultural output to A$100bn (nominal).
- At the time of the target, the industry was valued at A$61bn.
- Recent years have seen the gap to A$100bn narrow, with farm output in 2022 reaching A$90bn.
- The majority of the increase in value in recent years has been from the cropping industry.
- The value of cropping has been driven by the gods (weather) and Putin (Ukrainian invasion).
- The rainfall and high prices drove the industry to new highs – but that is outwith the control of the industry.
- If inflation stays at high levels, then the industry will have just stood still if it achieves A$100bn.
- The real target may have to be adjusted to A$125bn+.
- A lot of our drive to where we have has been through luck.
The Detail
In 2018, the NFF made an ambitious plan to grow Australian agriculture to a humongous target of A$100bn. It is good to have a target, something to aim for.
We are now in 2023 and nearing the halfway mark, and we thought it was worthwhile. So let’s start with the review and where we are.
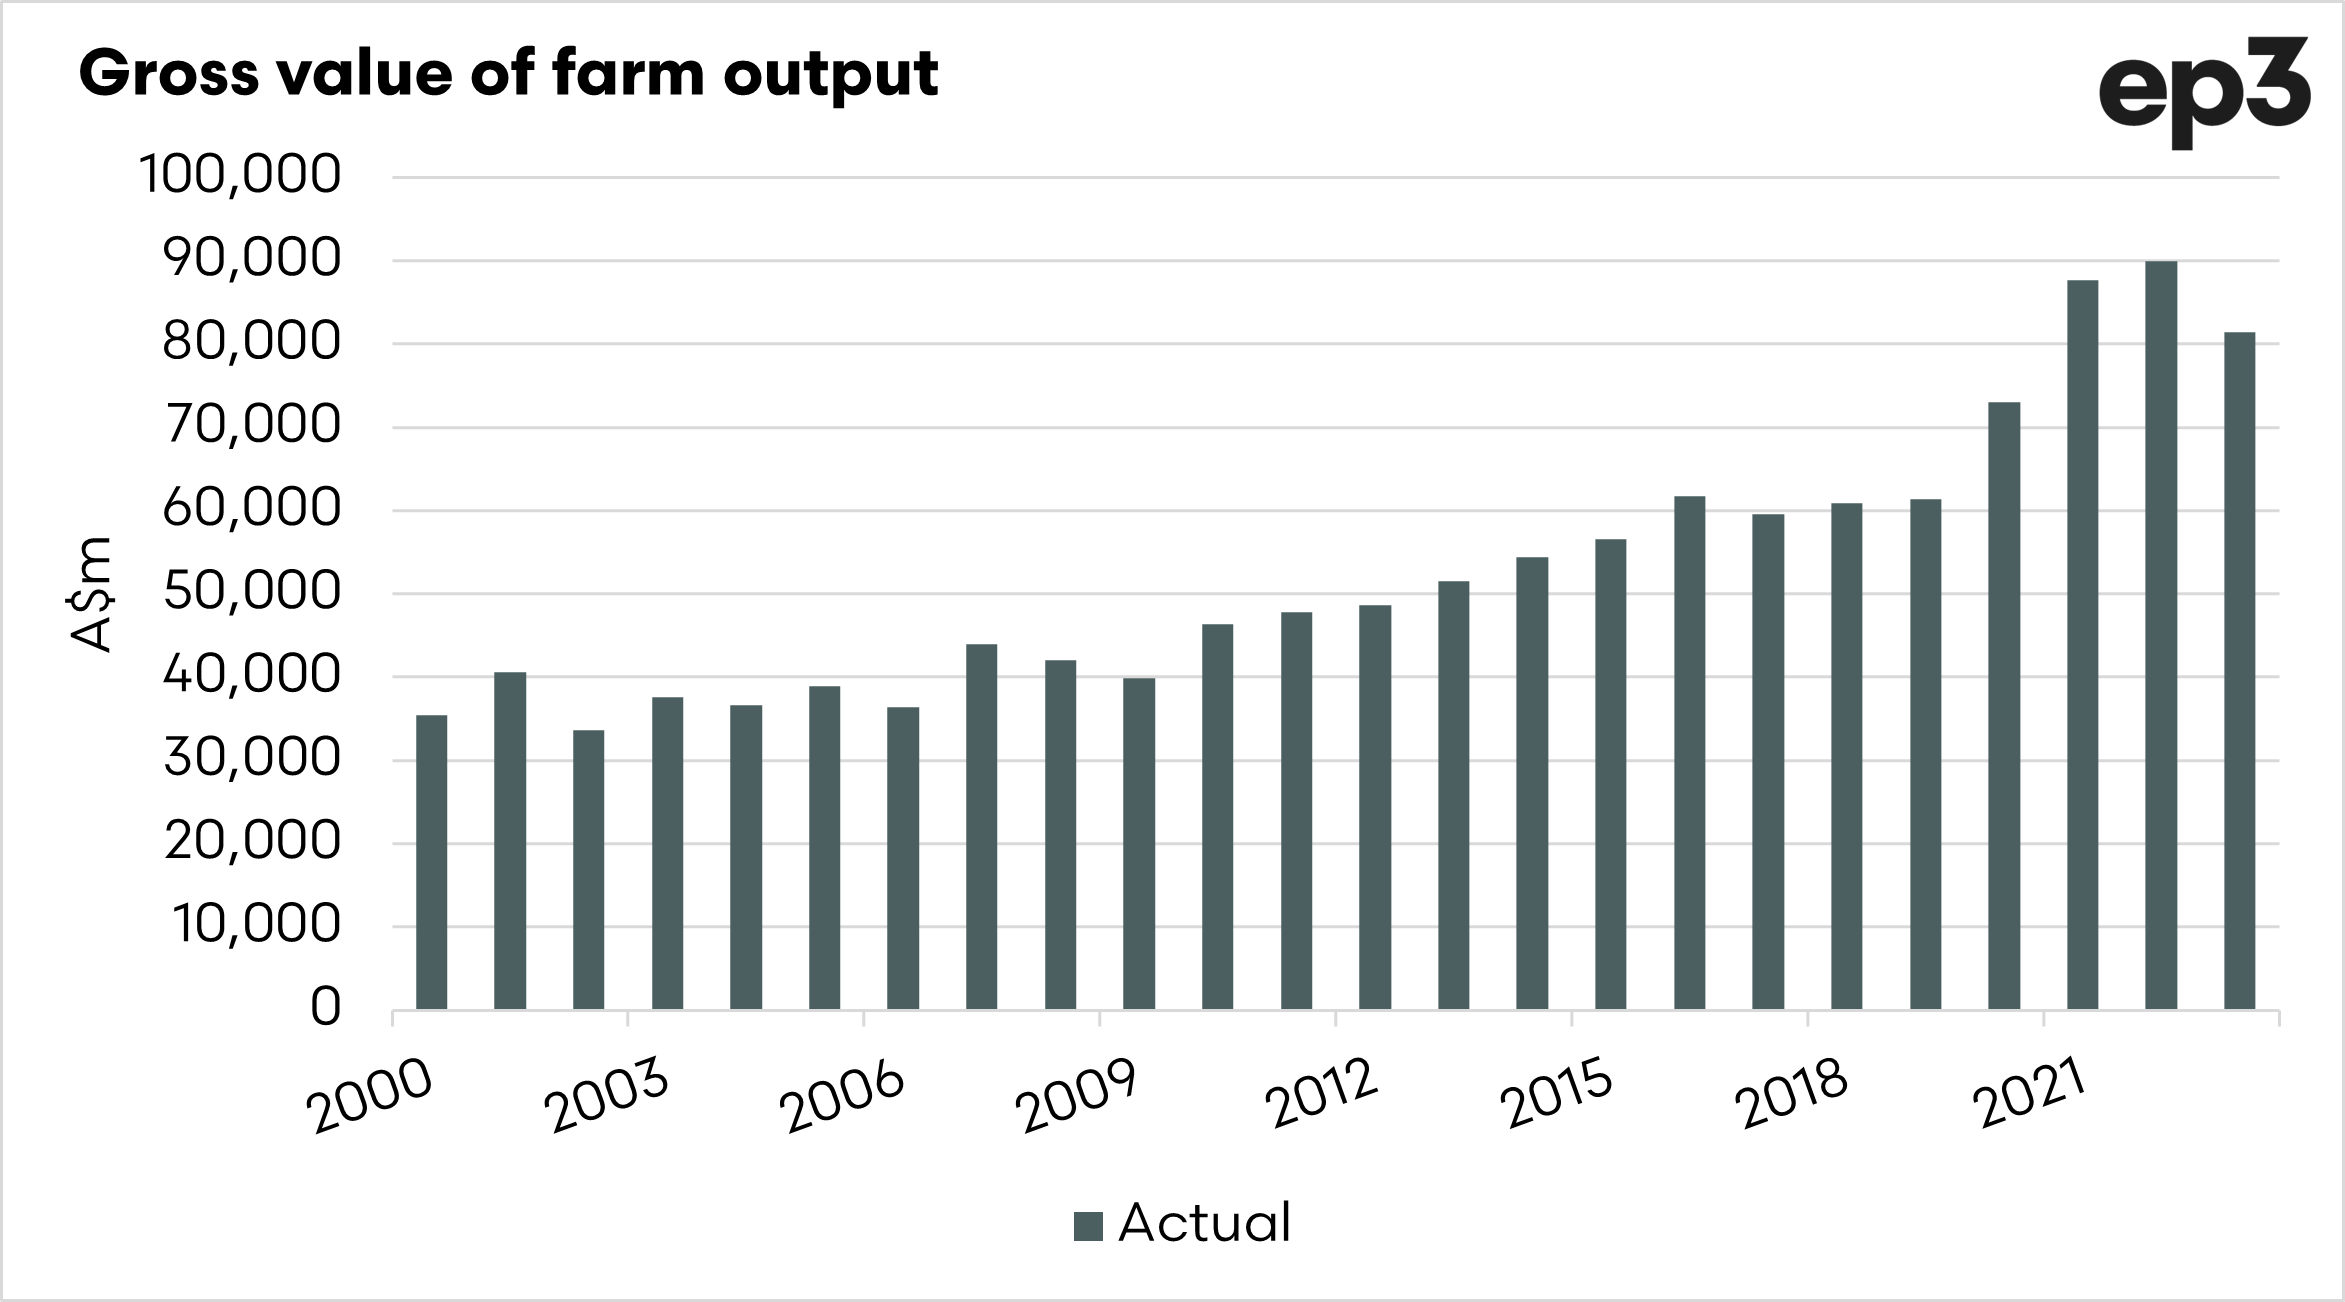
When the target was initially announced, the industry had a gross value of farm output of A$61bn, giving the industry nearly A$40bn to improve output.
In the past few years, we have seen farm output increase massively. In 2022, the farm output reached A$90bn, a fair increase from when the target was announced, and only A$10bn short of the 2030 target.

What drove the value?
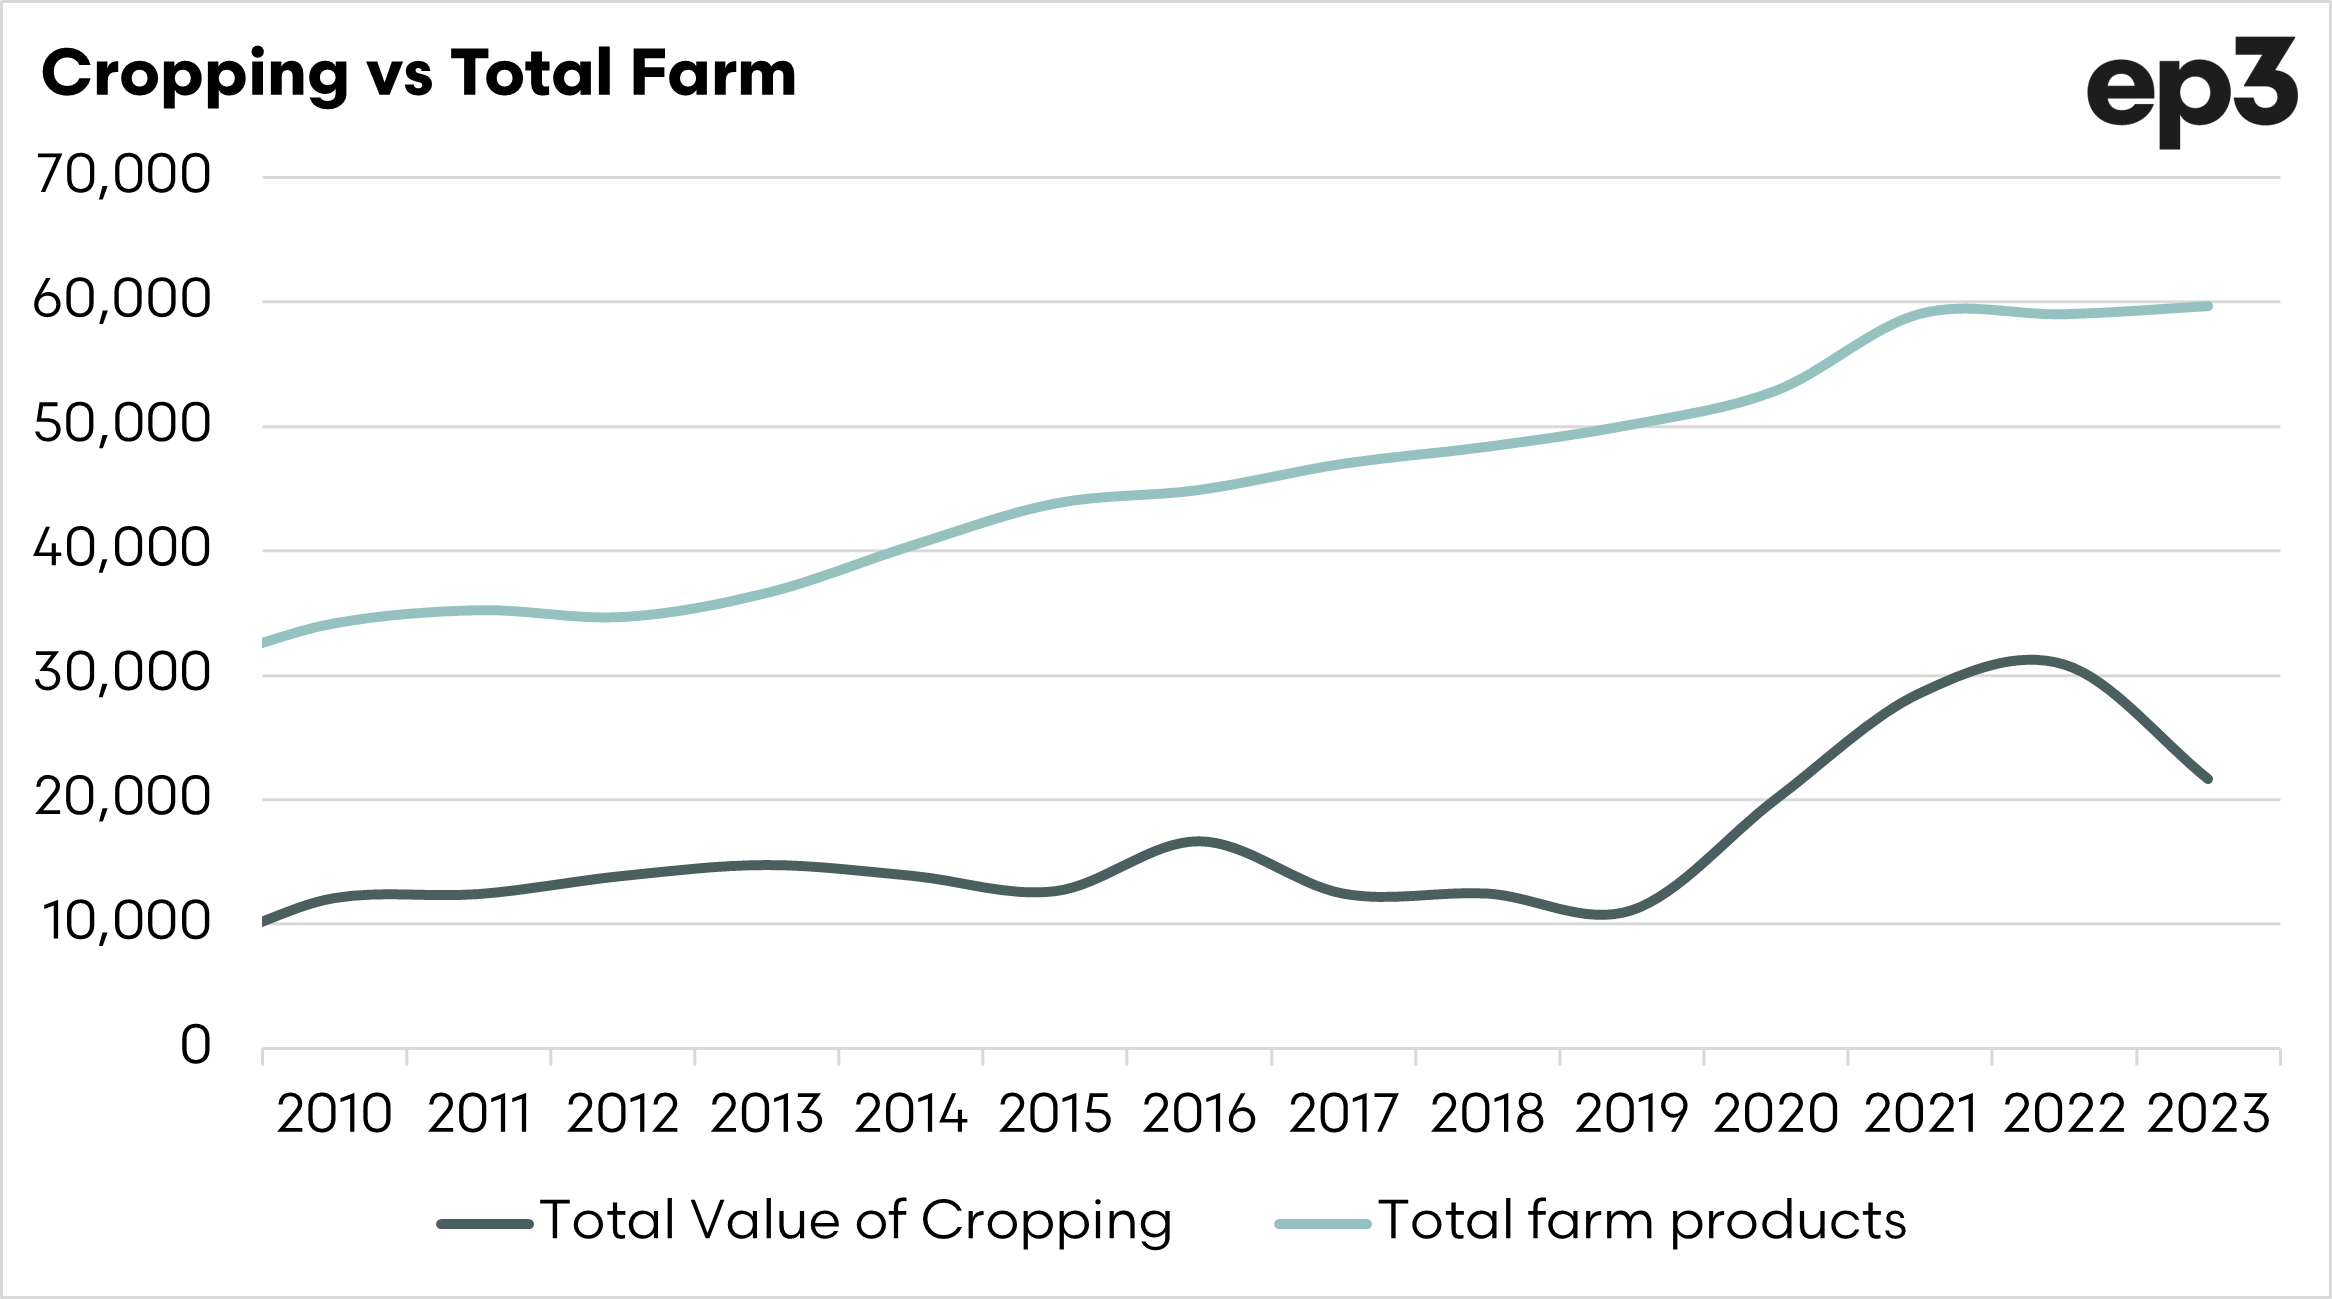
There has been one industry that has pulled a lot of additional weight during the past two years and that has been the grain industry.
The chart below displays both the total cropping, alongside the total farm output (minus cropping). We can see clearly in this chart that the overall non-cropping has stayed relatively flat. The cropping output, however has gone absolutely through the roof.
It has done the heavy lifting of bringing agricultural output to a mind boggling A$90bn in a short period of time.

The important thing to consider now is how we continue this trend. What has caused the large increase in cropping value, and how can we repeat it?
Let’s start with the local conditions.
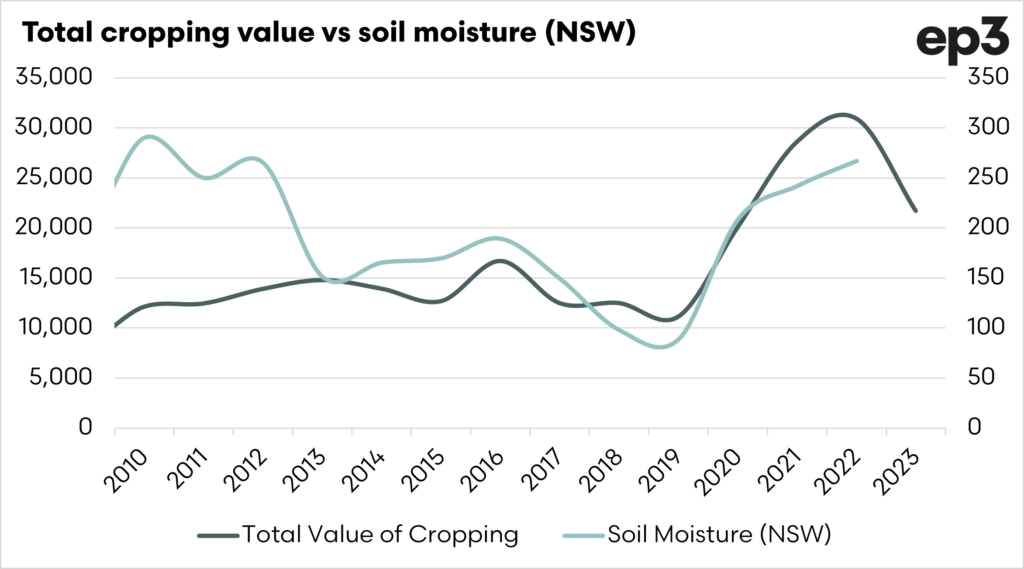
One of the biggest drivers, probably the largest, was the weather. As we all know recent years have been exceptionally moist.
The chart below displays the average soil moisture versus the total value of cropping. Rain makes grain, and output was up (as we all know).
It’s not all local.
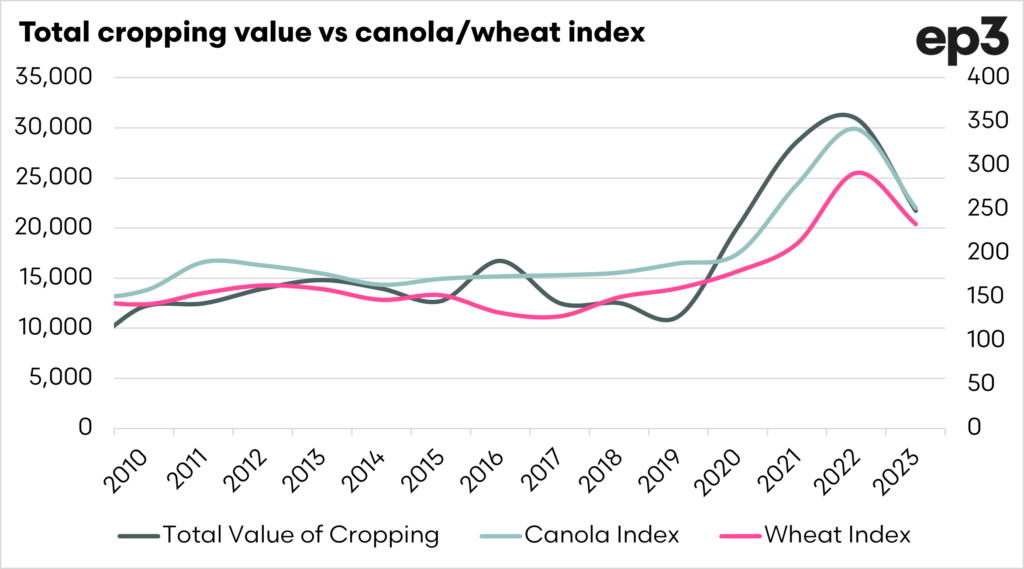
The rainfall has provided the grain to sell. The second part of the equation is price, and we have seen some superb prices for our grain crops.
We had both canola and wheat hitting nominal highs.
The canola market was primarily driven by a terrible drought in Canada, severely limiting their production. As the world’s largest supplier to the export market, this drove prices to extreme levels. As the second largest exporter, we benefitted from high pricing levels.
As production has ramped higher, the price has started falling.
The wheat industry rose through much of last year. This was largely in part due to the Russian invasion of Ukraine. Combined these nations provide approximately 30% of the worlds tradeable wheat.
As exports started back through the grain export corridor agreement, prices started to slide. It’s to be determined whether this trade corridor will continue.
In summary, we have two things driving the cropping value. War and the weather. These are both things outwith the control or influence of the Australian agricultural industry. They are currently the largest drivers to A$100bn.

As part of this review, it might be worthwhile looking at inflation. How far does inflation get us to the A$100bn target?
I thought it would be worthwhile to plot the value of output against a couple of scenarios in the chart below.
The grey line displays the actual farm output value since 2000. The increase in value was pretty linear since the start of the last decade, with a huge jump since 2020, led as per above, cropping.
The pink line shows how the industry would have performed if the industry had followed inflation. If we had simply followed inflation, we would have grown the industry to A$73.5bn this year.
The light grey line shows is based on using the inflation rate for the 5 years preceding the creation of the target (2%). If using this inflation rate, the industry would have reached A$75bn by the end of the decade. Quite a bit short.
Inflation is currently nowhere near 2%; we are currently sitting at around 7%. We don’t know what inflation will do over the coming years, but it is unlikely to stay at 7%, as the RBA have targets for inflation at 2-3%.
If inflation averages 4% over the coming years, then the industry will reach A$97.5bn. In effect, this would just be keeping up with inflation.
The current ambitious target of A$100bn is a nominal value, not a real value. If we hit A$100bn in 2030, there is the potential that we would just have been treading water.
If the 2018 target was in real terms, then the real target should be A$125bn+, depending on the inflation projection you use as you head toward 2030.
As an industry, we have to be careful about taking credit for the increases in the industry’s value, especially when the weather and Vladimir Putin have been the main contributors to our success.
Success has many fathers, but failure is an orphan.

