Preparing for the drought?

The Snapshot
- FMD accounts peak in June, ahead of the end of the financial year.
- On a yearly basis, FMD accounts have been increasing until the last two years, where the national June balance dropped for the first time.
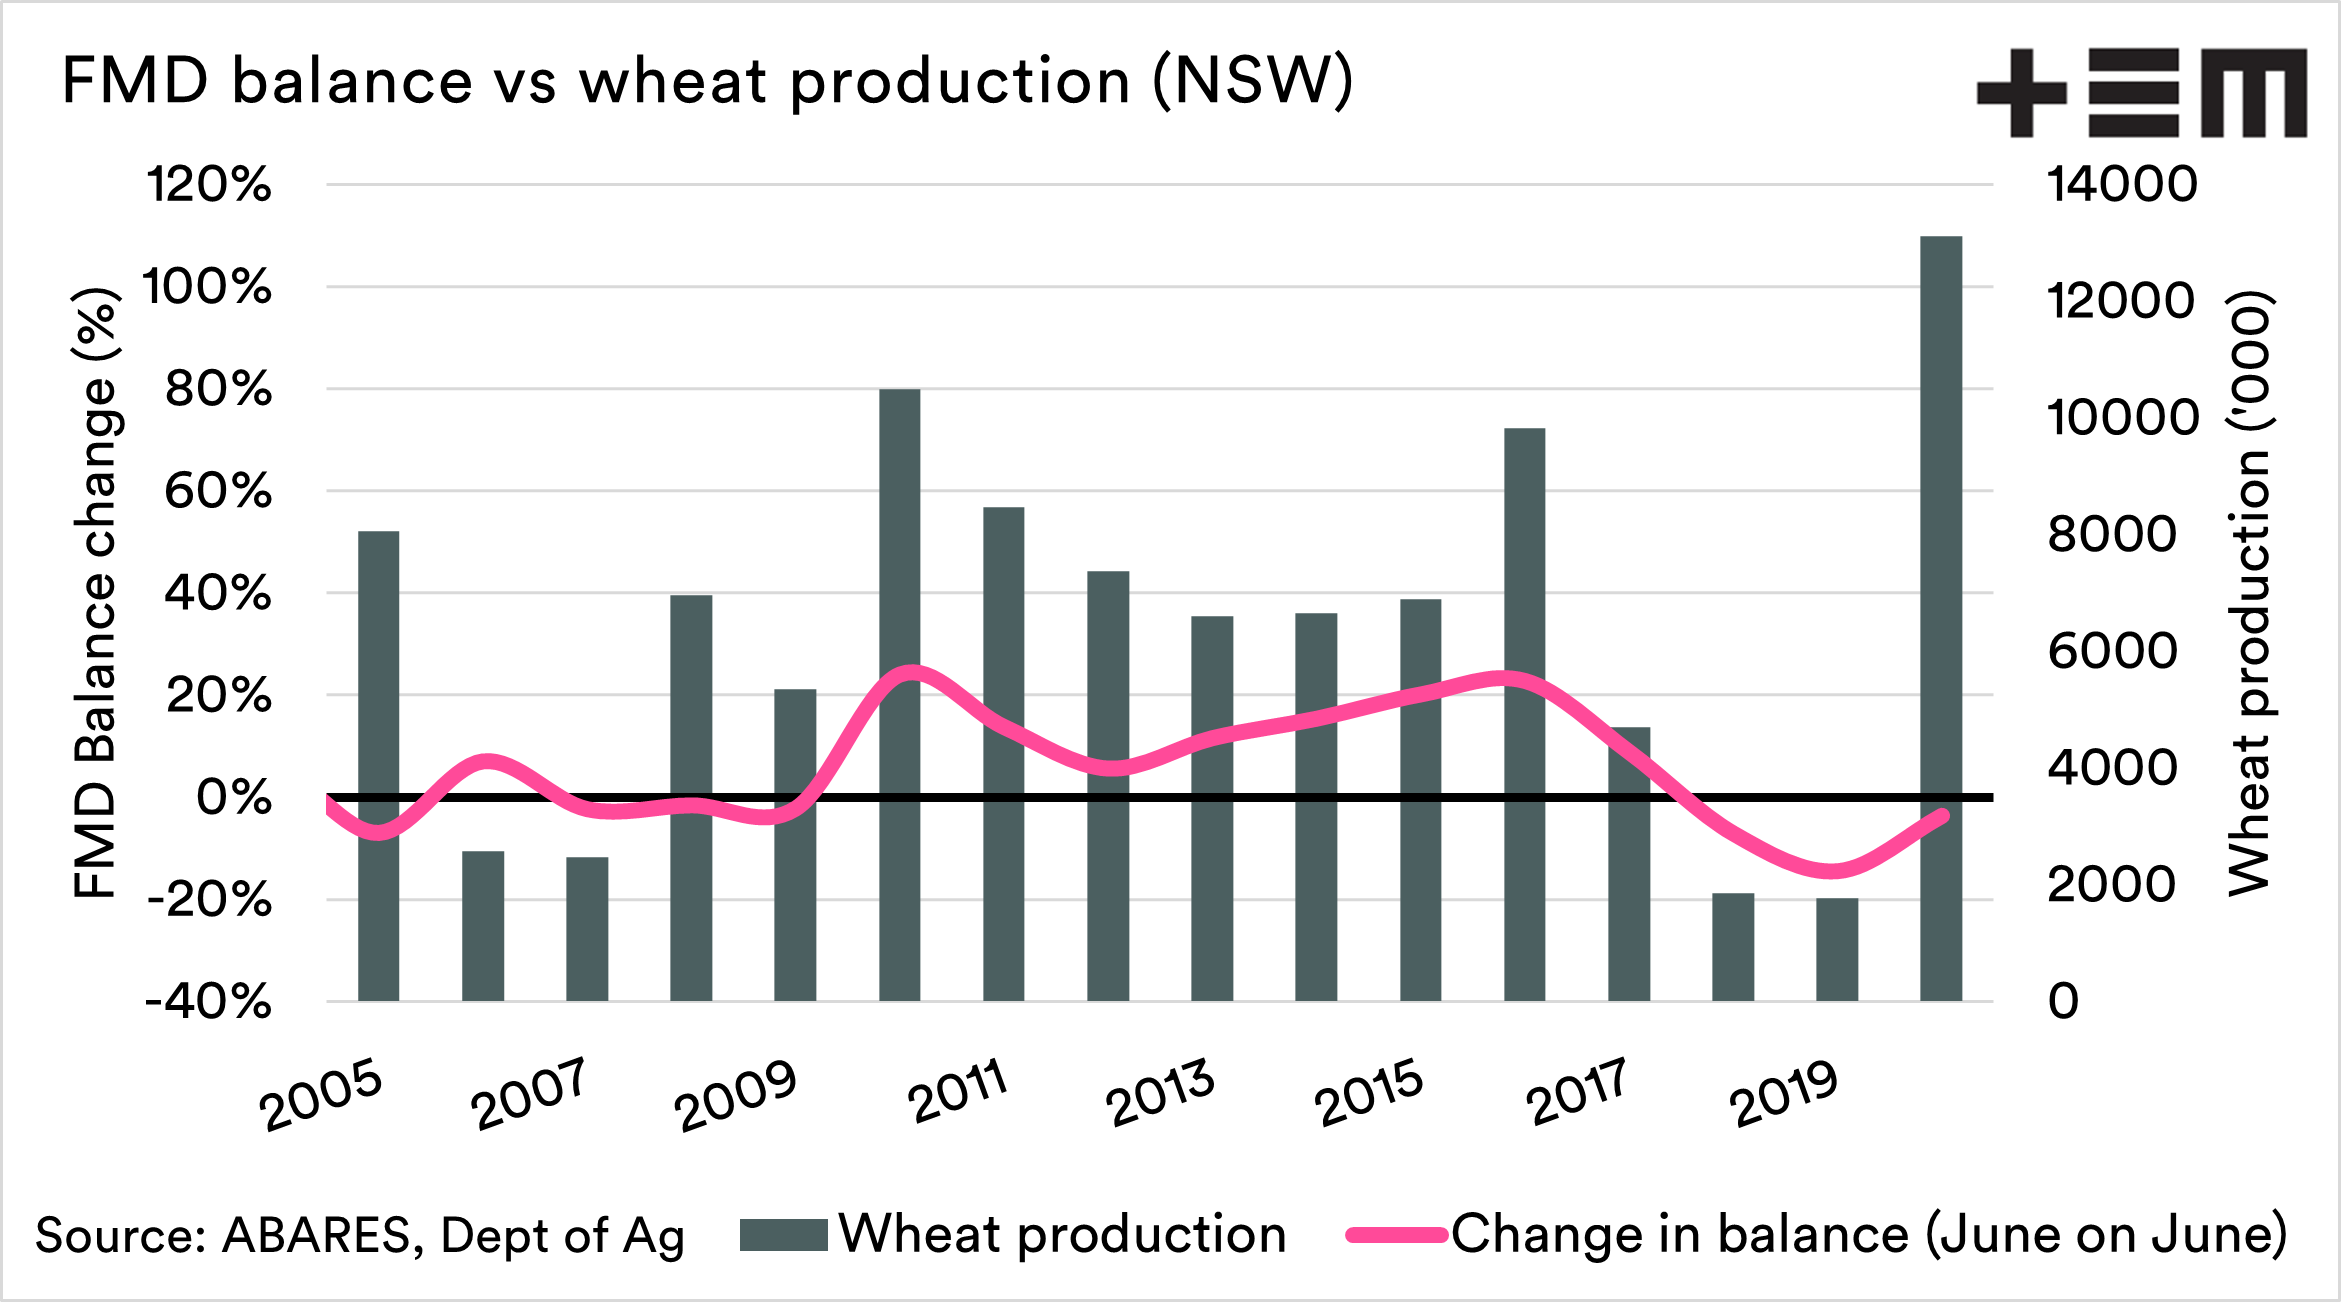
- Cropping/grain accounts around the country have followed production.
- Higher grain production leads to higher deposits, and vice versa.
- The last year has seen high production but lower deposits.
- This could be a result of lingering drought or the instant asset write off.
The Detail
We know that the bad years will come. It’s an inevitability. Farm management deposits (FMD) are a great tool for Australian farmers. The purpose is to allow farmers to hold income from the good years for the bad years. Are they doing their job?
I spent some time yesterday afternoon pulling the data together on FMDs to see if there is a story in them.
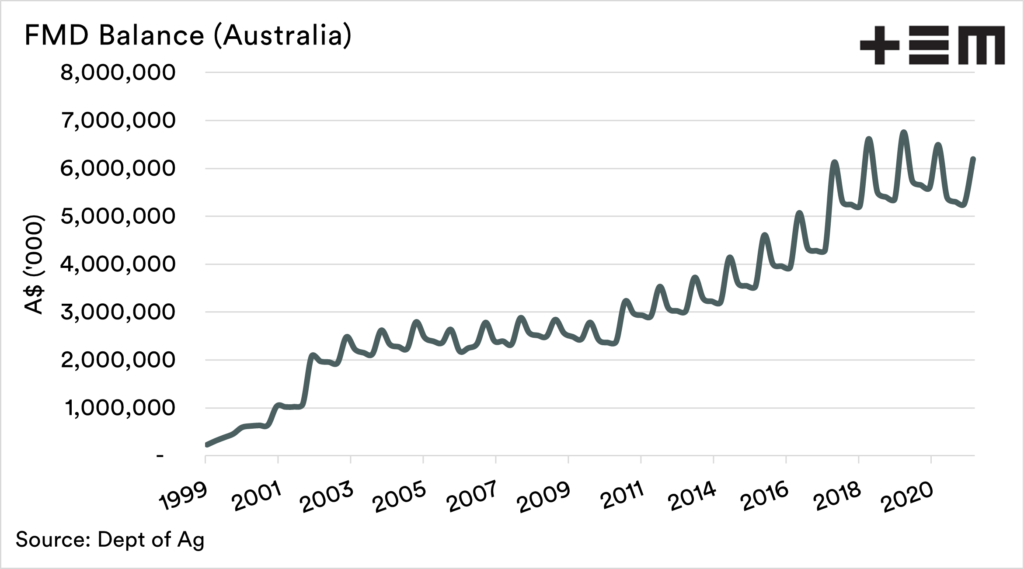
The chart below shows the overall FMD balance at the end of each quarter since 1999. It’s an odd locking chart as it peaks once a year. The peak occurs during the end of the June quarter as farmers funnel money into FMD’s ahead of the new financial year, then farmers reduce their balance in the next quarter.
The peak each year in June is the important period, and from the chart below, we can see that the balance peak was increasing each year until 2020, when the national average balance dropped. Australia is big, and therefore there are differences between states, and when I look at the state by state data – NSW has shown the most pronounced fall.

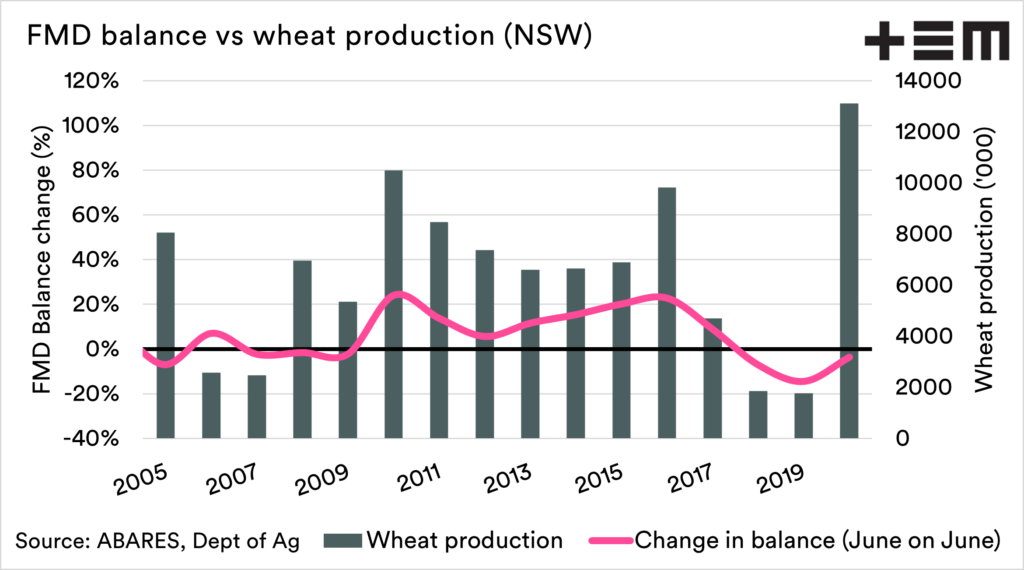
The FMD data is segregated into various industries (from 2014), from pigs to sugar. I am more interested in the impact on cropping operations and have delved in a little further. Interestingly there are two very similar categories, crops & grain. I have combined these together and compared them against grain production in each state.
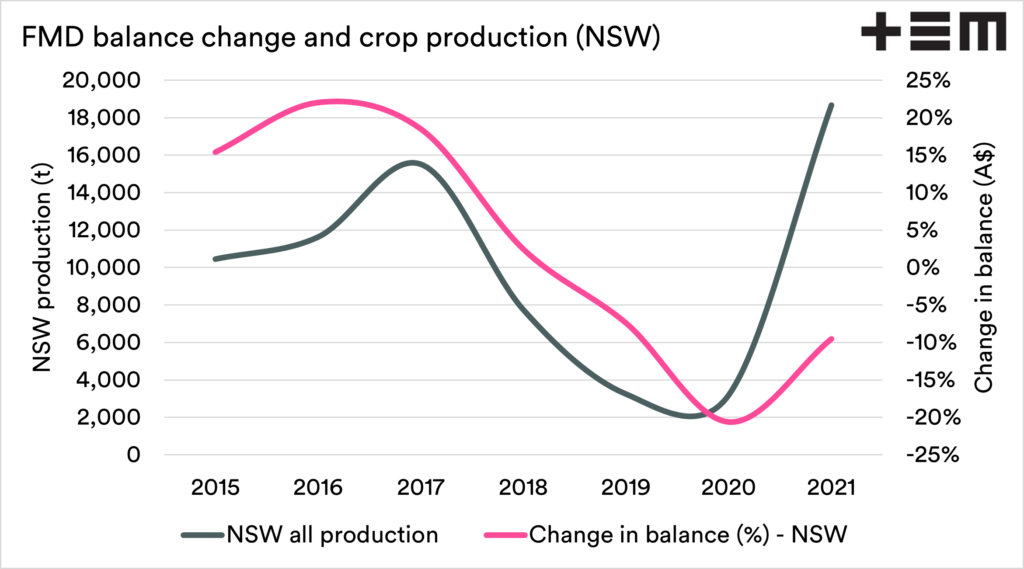
The chart below shows the change in FMD balance between June and June, the peaks between years. This is overlaid against the production of all crops for the season that corresponds best.
We can see that there is a reasonably close pattern between the two. As production falls, then deposits into FMD’s decline, and withdrawals increase.
This pattern is shared across all states (charts available on request or on twitter). The biggest change in the pattern has been this year, where the production has increased dramatically. Still, the balance increase hasn’t corresponded as well. Why?

There are a couple of potential reasons:
- Lingering effects of drought. After the mid-2000’s droughts, it took several years before farmers started positively increasing their FMD balances.
- Other tax options. The instant asset write off may have encouraged farmers to spend as opposed to placing money in an FMD.
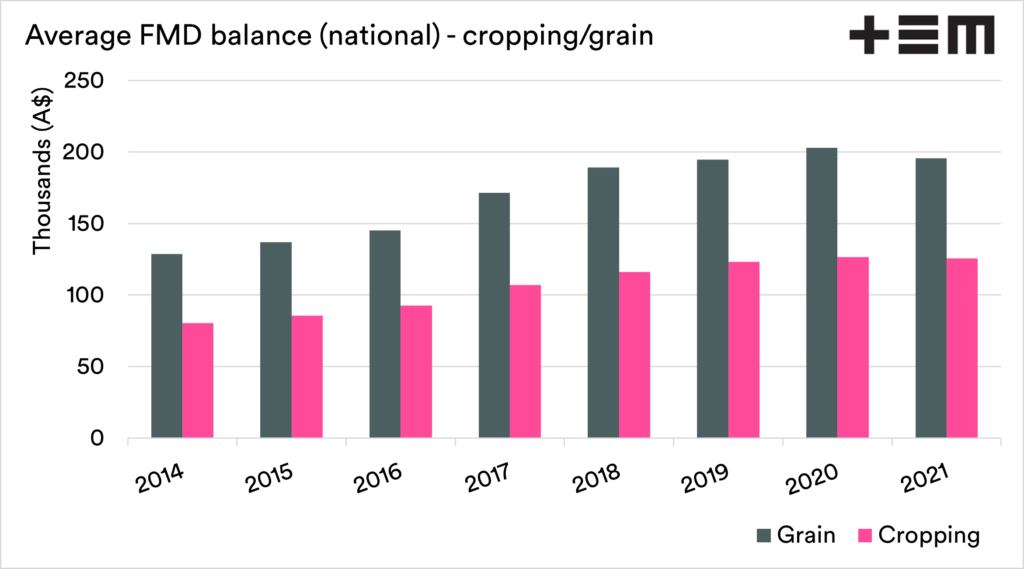
The average per grower. Based on the total held in FMDs against the number of accounts. The average value held in an account labelled cropping is A$125k, and A$195k those labelled grain.
There is a cap of A$800k on FMD balances. Whilst the average balance is well below that level; we know that there are large and small farmers. There have been concerns that some farmers have filled their FMD bucket through discussions with farmers and farming representative bodies.
All in all, we believe that FMDs are a valuable tool and are meeting the intended purpose. At the moment, the stars are aligning with productivity and price both strong; we should be using this time to prepare for the next drought.
FMDs are one of the tools to do this.