
Who are the winners and losers in Aussie ag?

The Snapshot
- The agricultural industry has the aim of achieving a value of 100bn by 2030 in Australia.
- The compound annual growth rate since 2000 has been 2.92% for the overall industry.
- If we maintain similar levels of growth, the industry will reach around 85bn by 2030.
- The cropping industry has grown by 2.45%, and livestock by 3.47%.
- The biggest growth industry in cropping has been Chickpeas and Canola.
- The biggest growth industry in livestock has been goats.
- Our of 33 commodities analysed, 26 have shown positive growth.
The Detail
Who doesn’t like a bit of rivalry? They occur everywhere, whether it’s rivalries between sports teams, Eagles vs Dockers, Celtic vs Rangers or even countries US vs China.
Let’s be honest; even individually, we will compare our performance against our neighbours. Who has the best crop in the district etc? What about agriculture?
The farming industry through the NFF aims to turn agriculture into a 100bn industry by 2030. I have been mulling this target over in recent days.
The reality is that agriculture is a disparate industry, with many different products, from honey to hogs. It got us thinking, which industries are driving things along.
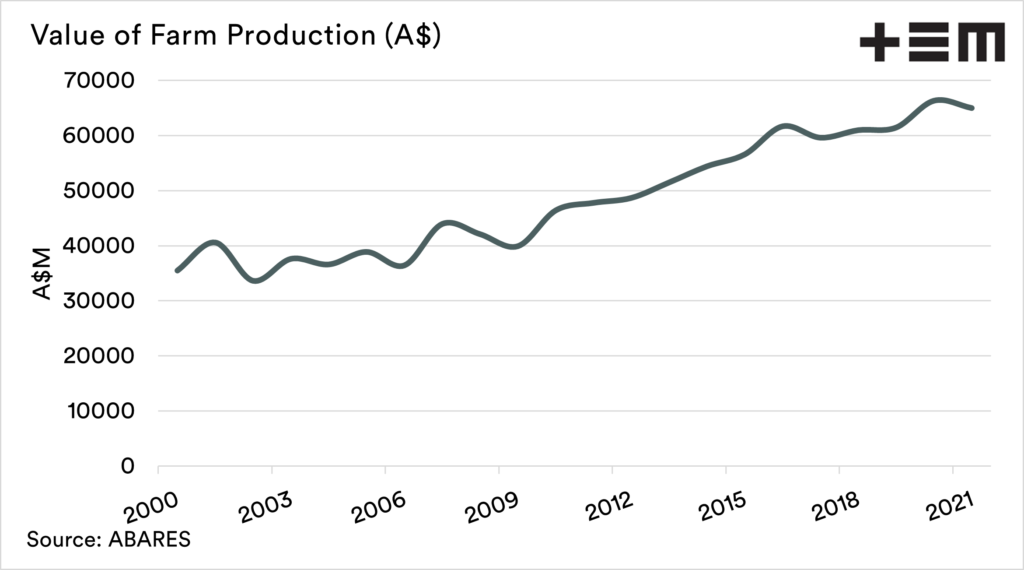
The overall value of farm production in Australia has risen from 35.5bn in 2000 to 66.3bn last year. This year ABARES forecast a value of 65bn. This was their projection as of June, but I would expect a healthy rise with recent upgrades to pricing and production.
This is a compound annual growth rate of 2.92%. So based on that annual growth rate continuing, the industry should get to around 85bn by the end of the decade. However, the aim is clearly to exceed this through the development of production and trade.
But that’s not what we are here to discuss. We want some rivalry. Which industry has shown the most growth in recent years?

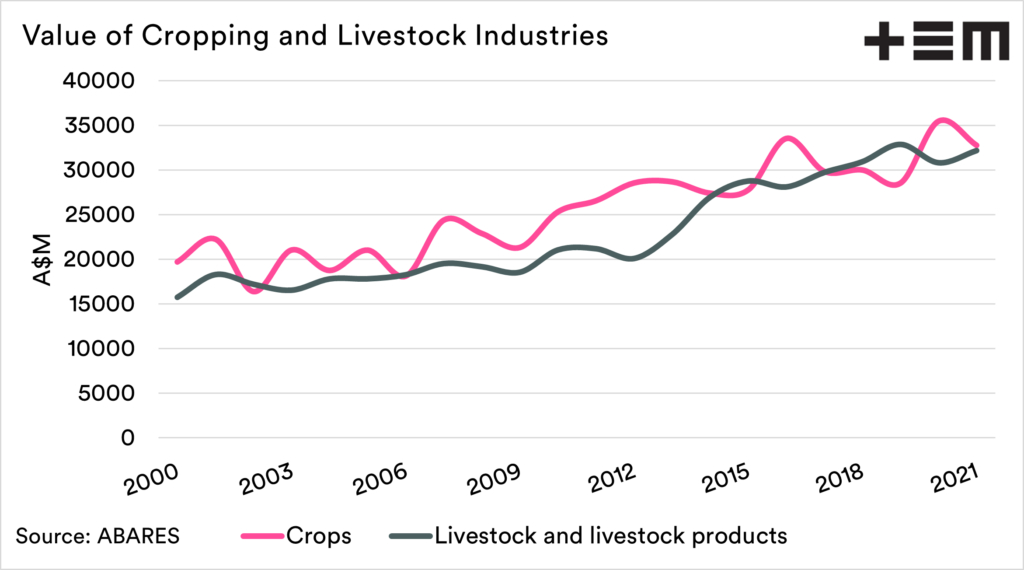
So let’s start narrowing it down. The chart below shows the value of production of crops (all grains and horticulture), and livestock (including wool/milk). These industries have both been following quite a similar path.
However, it is livestock that has shown the greatest growth. The compound annual growth rate for crops has been 2.45%, and livestock has been 3.47%.
The livestock industry started off from a lower base at the turn of the century but has made some very impressive progress since 2012.

Cropping
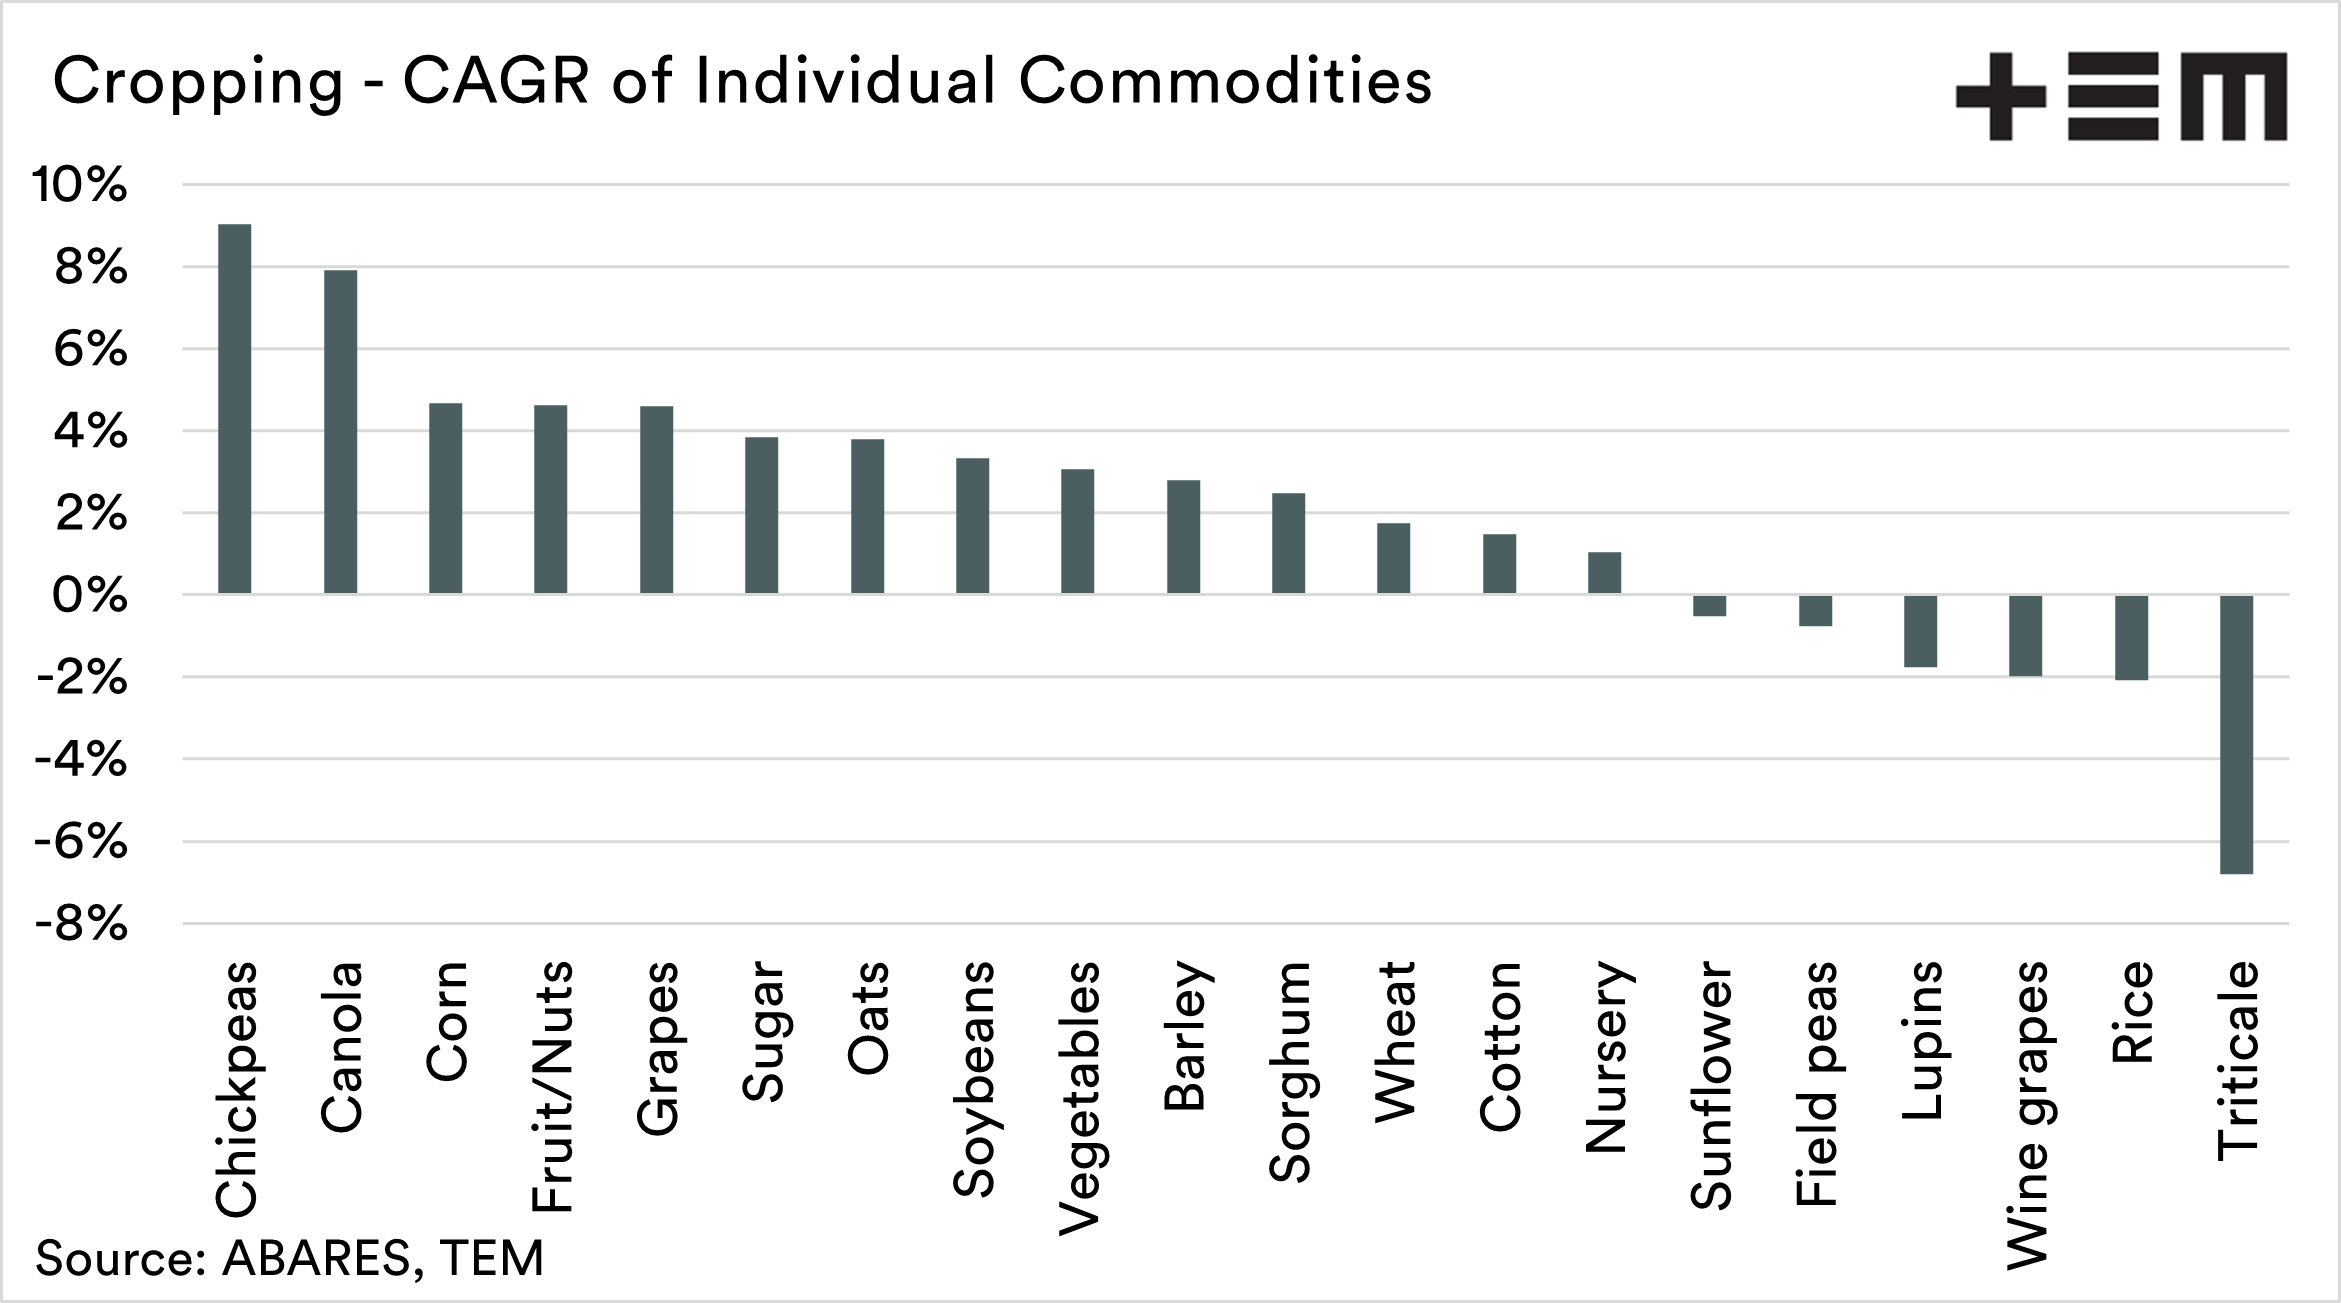
The chart below shows the individual cropping enterprises and their rise and fall in terms of overall value. The chart is quite stark, with crops like Chickpeas and Canola having a very strong growth rate since 2000.
At the other end of the spectrum, we have crops like triticale, which has shrunk in value.

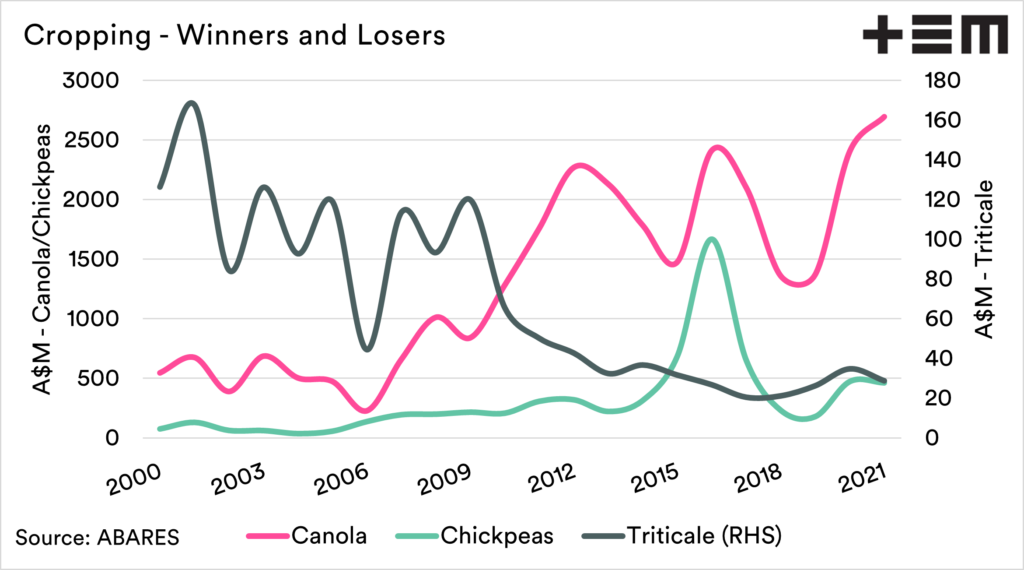
In the chart below, I have displayed the annual value of the winners and losers, Chickpeas, Canola and Triticale. We can see that Canola and Chickpeas started at a low base, whereas Triticale has massively fallen out of favour.
The large changes in these two ends of the spectrum are primarily a result of increased acreage, as more growers have planted canola and Chickpeas. Triticale, on the other hand, has been largely thrown on the scrap heap.

Livestock
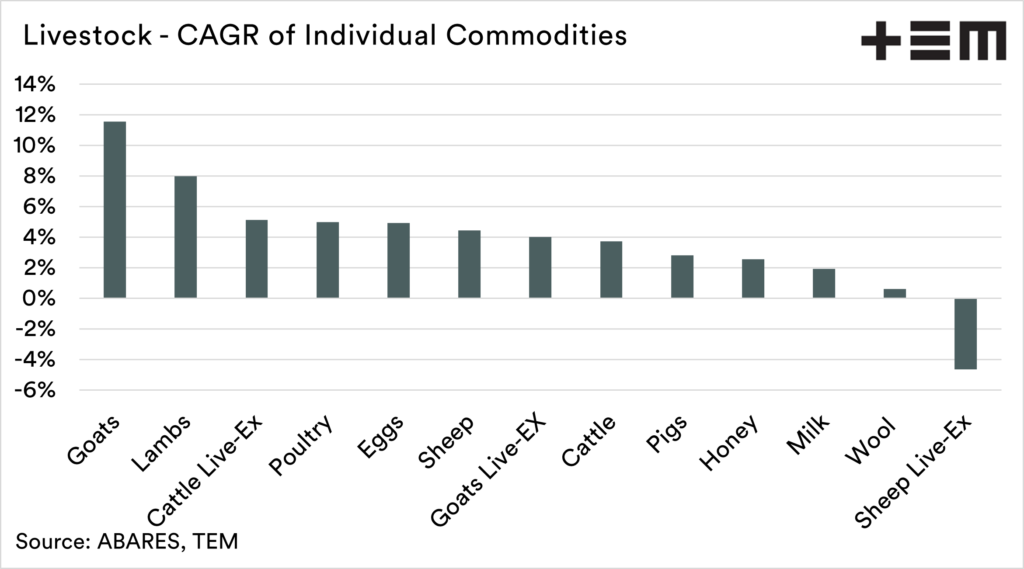
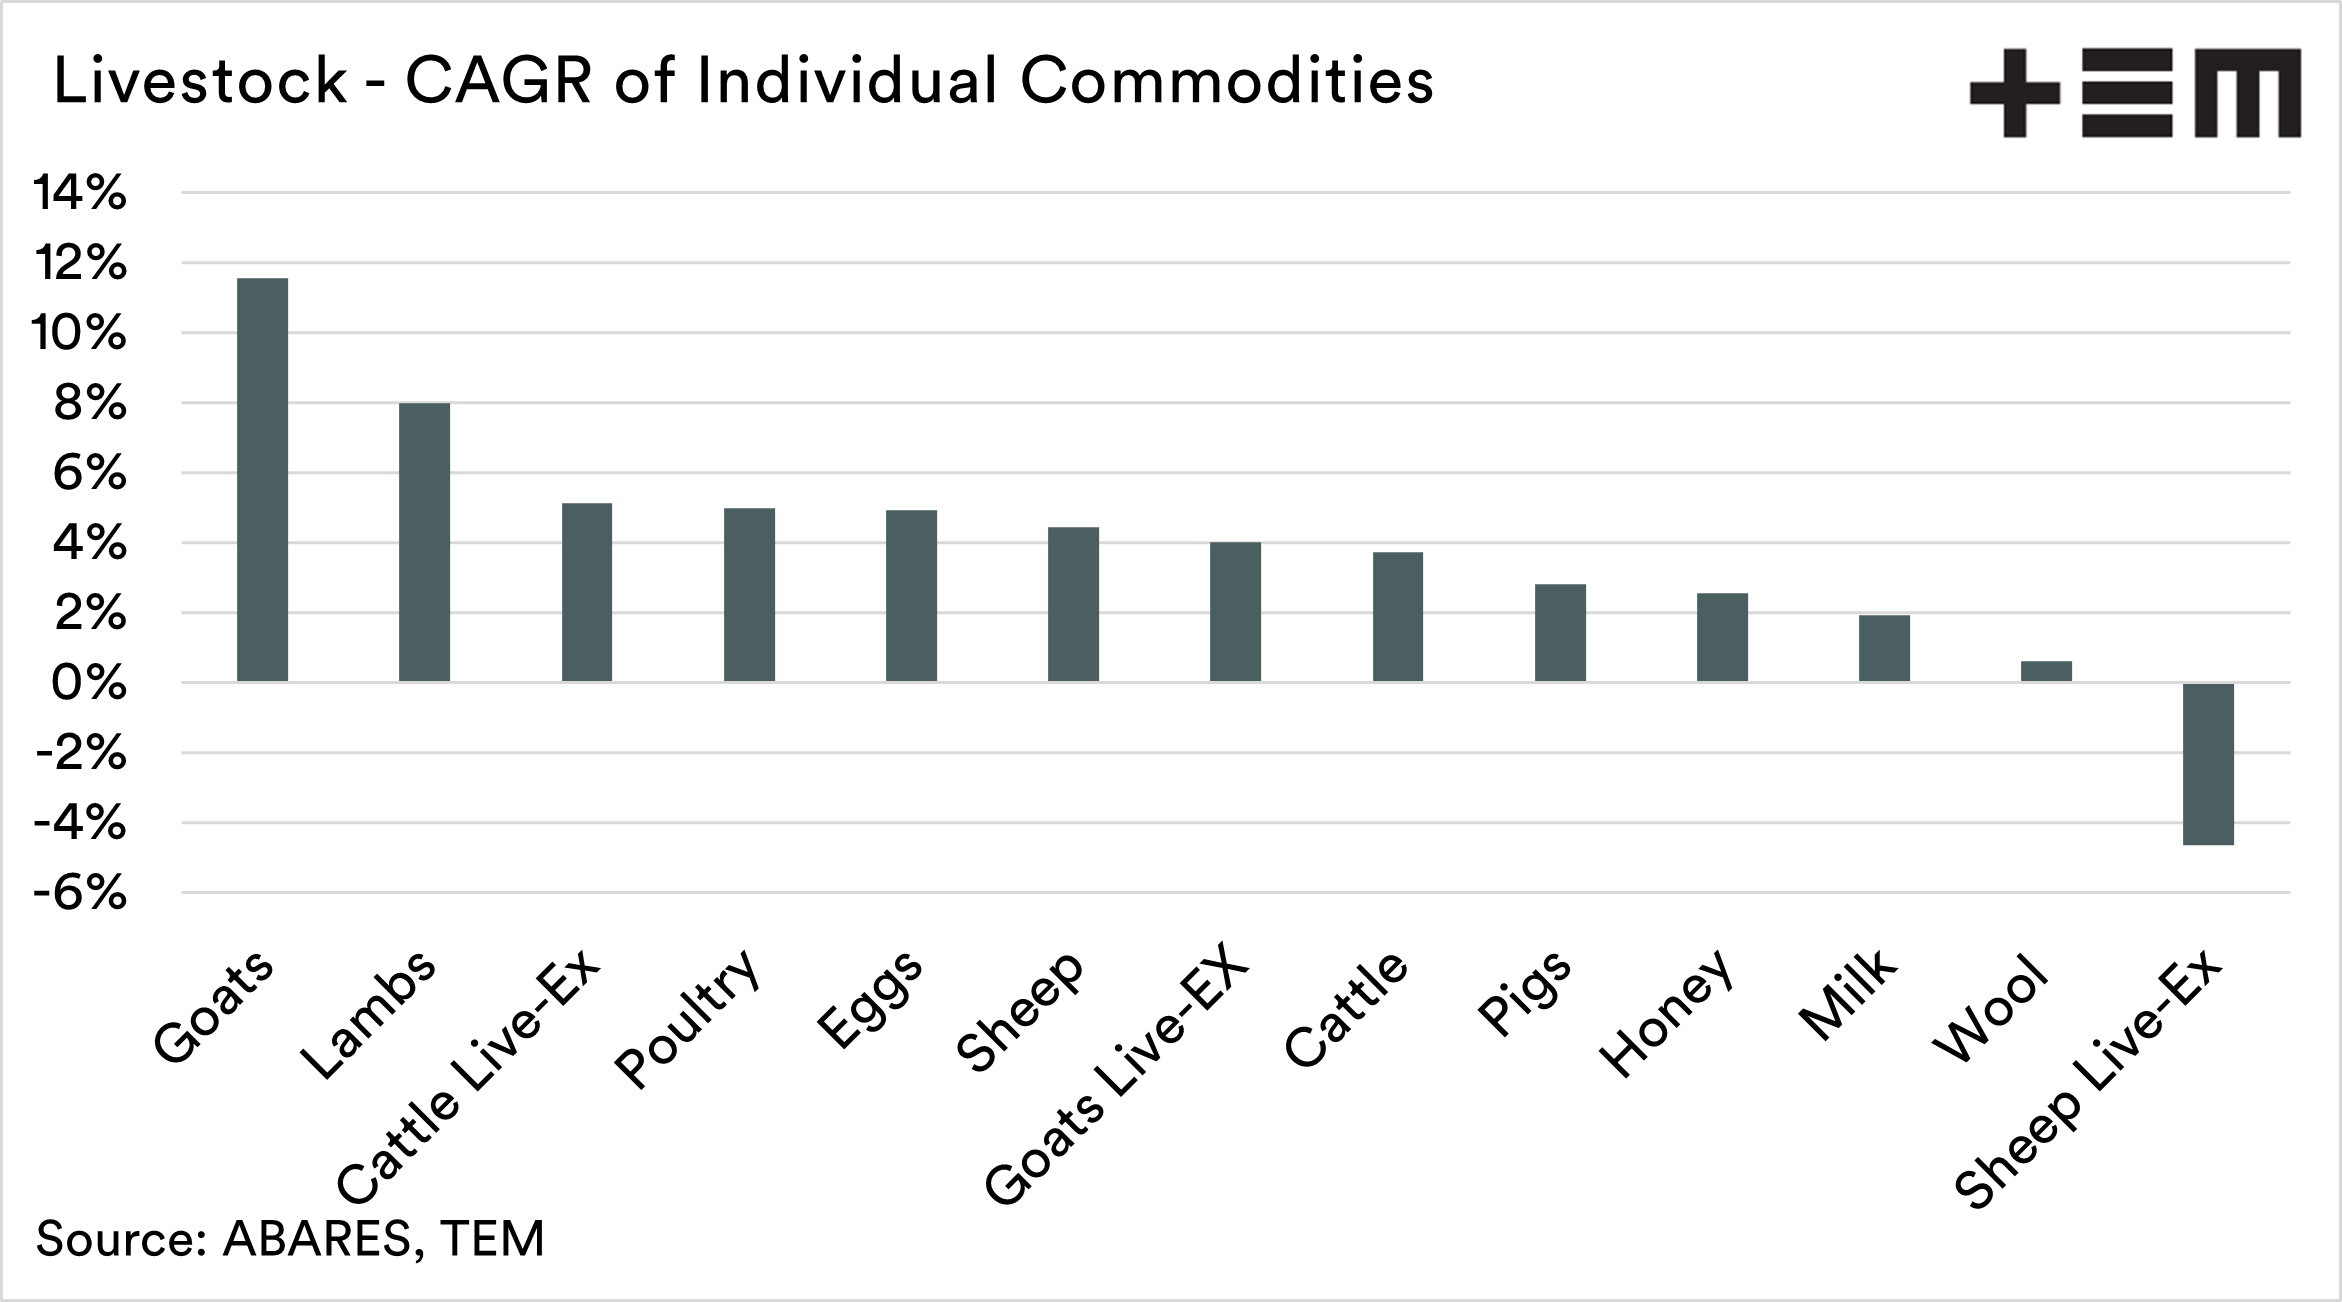
Earlier I had mentioned that livestock had experienced greater growth than cropping since 2000. It is interesting to again delve into which individual commodities have been the winners and losers.
There has been massive strength in goats, with the compound annual growth rate being close to 12%; at the opposite end of the spectrum, the live export of sheep has been the sole loser.
We have spoken about the rise of the goat in previous articles (We’re not kidding & Getting on my goat). The price of goats has rallied strongly in recent years, but so has the commercialisation of the industry.
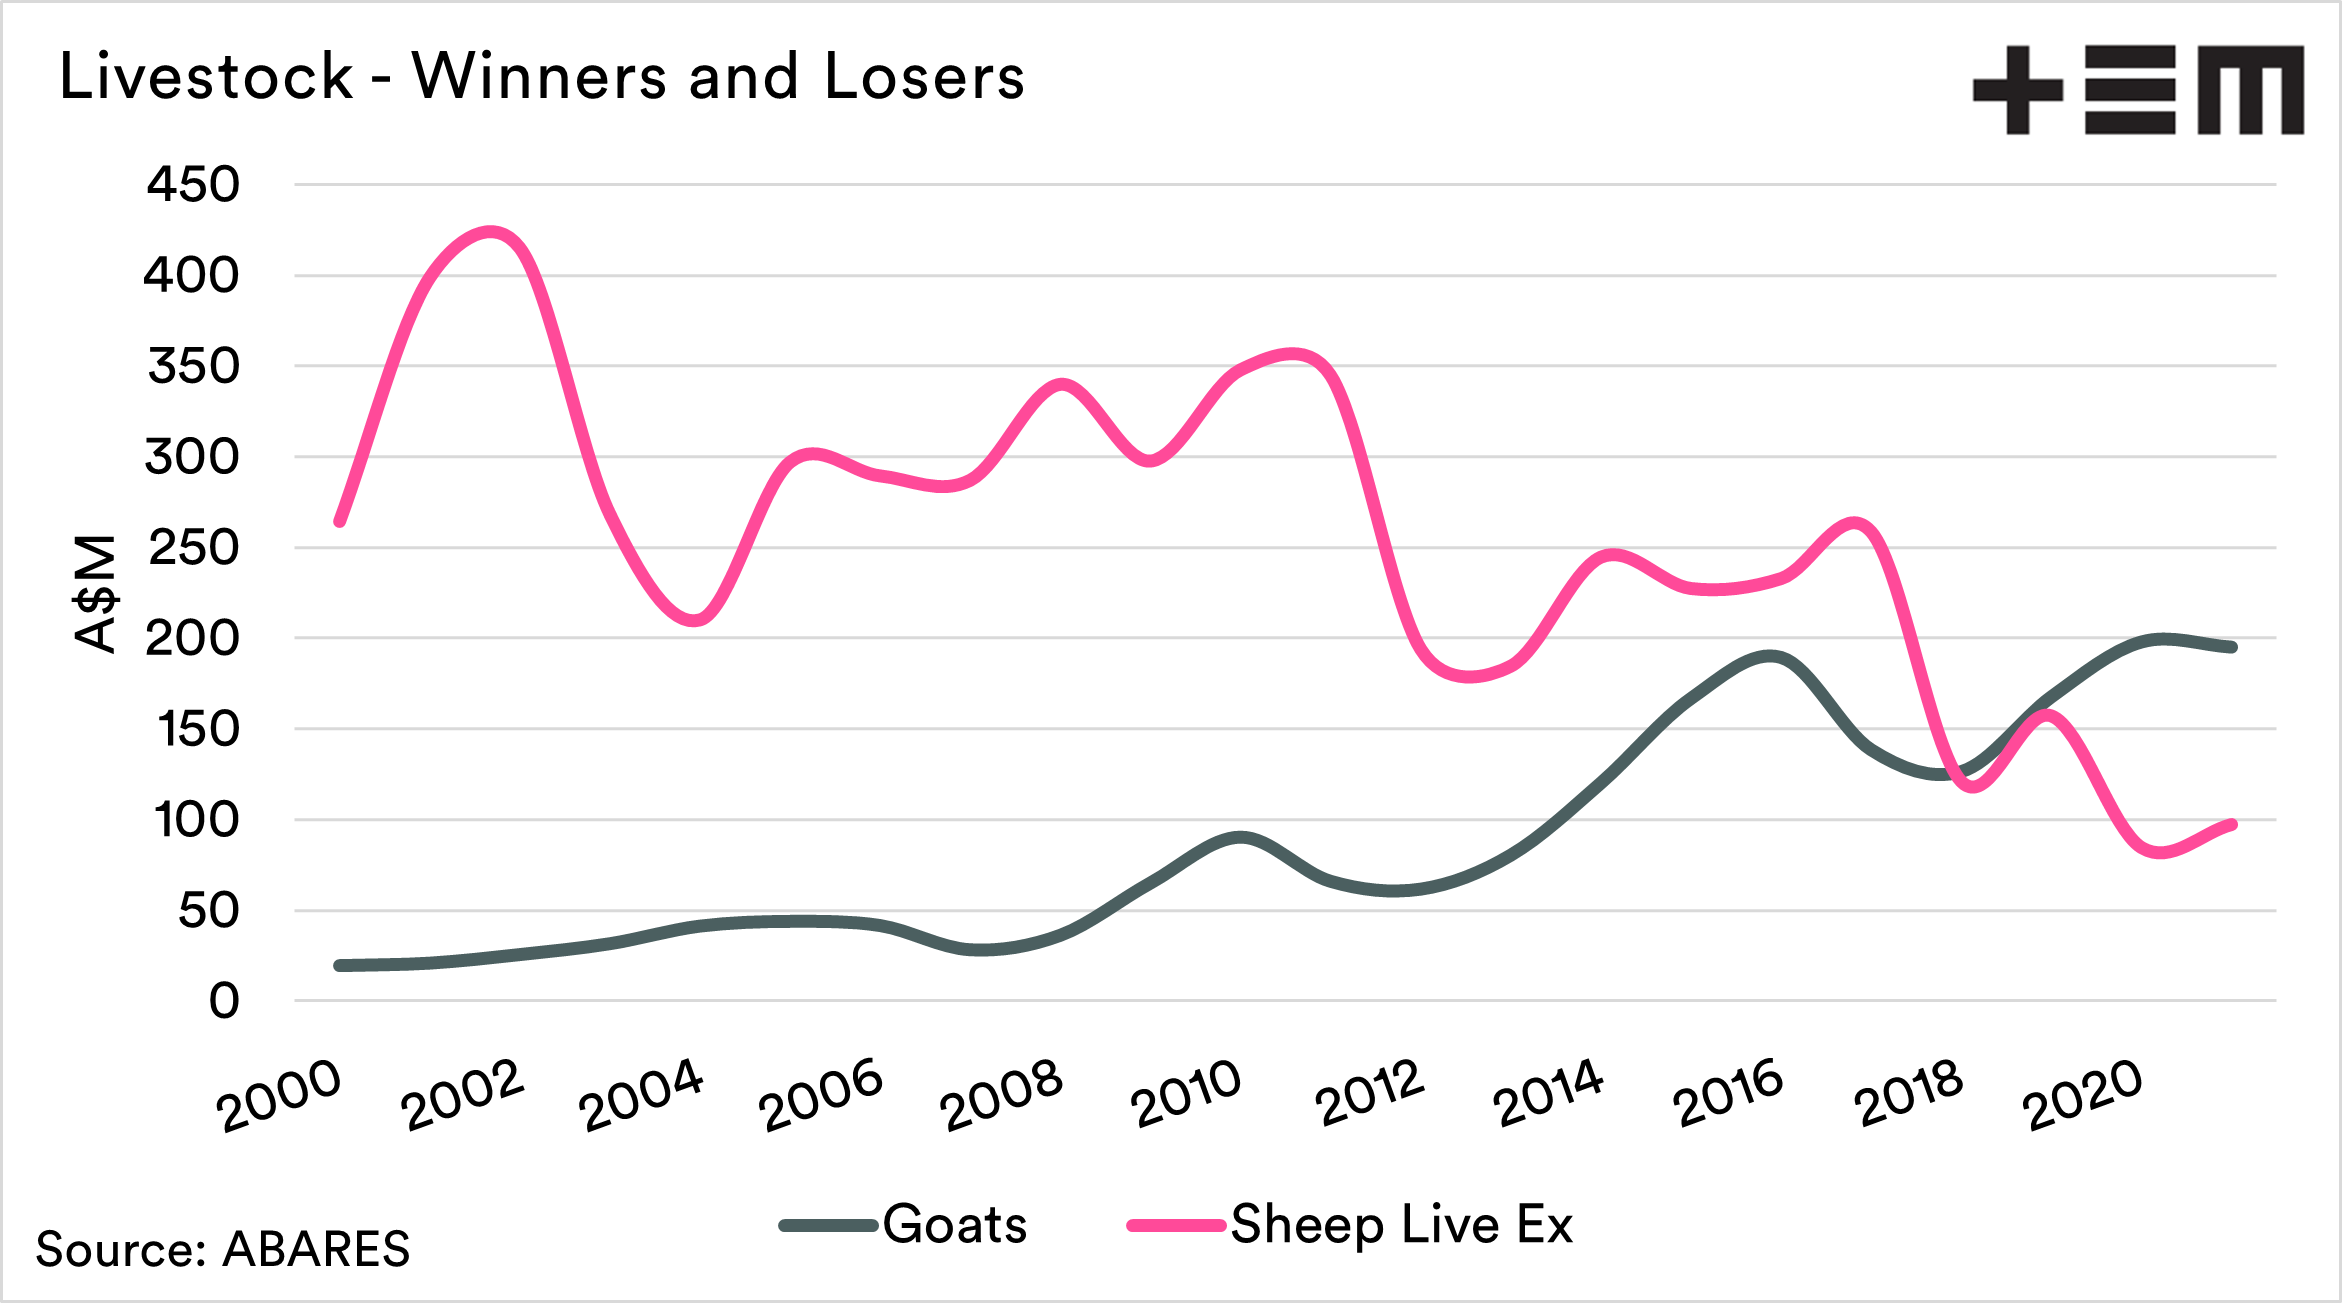
The chart below shows the domestic slaughtered goat industry vs the live sheep export industry. In 2000, the live export of sheep was valued at 13x domestic processed goats. It is now worth half the value of goats.
That is a stark change in 20 years.
The sharp fall in the value of the sheep live export industry can be seen occurring in 2018, which coincides with the moratorium on live exports of sheep during the northern hemisphere summer, and the period of most demand.

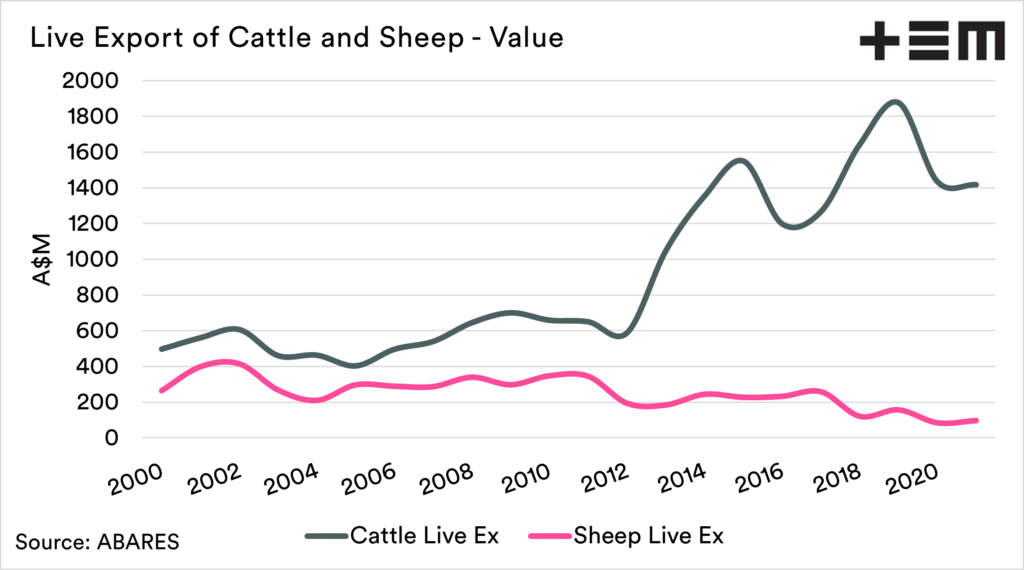
The live export industry has been one of two sides, cattle and sheep. The sheep industry has seen decreased volumes in recent years due to the northern hemisphere moratorium. The cattle industry, on the other hand, has experienced the benefit of both higher values and volumes.
Whilst recent years have seen strong sheep pricing overall, in the past the live export industry has been an important release valve in times of drought, especially in Western Australia.

So who are the winners?
Overall the agricultural industry is progressing in a positive direction in terms of value. The reality is that some commodities are experiencing more rapid growth than others. This is a combination of changing enterprises mixes, acreages planted and price.
Farmers will select the commodities that best suit their lands. To get to 100bn by 2030, the barriers will be removed to allow enterprise change. Barriers can also be put in place, which can negatively impact the value of the industry, such as the live export moratoriums.
At present, out of 33 commodities analysed, in terms of value, 26 of them are showing positive growth, with only 7 showing a reduction in value. If you’d like to see details on individual in more detail, feel free to reach out on our contact page.
If you liked reading this article and you haven’t already done so, make sure to sign up to the free Episode3 email update here. You will get notified when there are new analysis pieces available and you won’t be bothered for any other reason, we promise. If you like our offering please remember to share it with your network too – the more the merrier.