Country Profile: India
Country Profile
It’s pretty shocking to see the footage of the terrorist attacks in Kashmir last week, and the resulting retaliation by Indian forces on Pakistani targets. It’s always going to be concerning when two nuclear-armed powers enter into conflict.
India and Pakistan became separate countries in 1947, when British India was divided during independence. This event, known as Partition, created India as a mainly Hindu country and Pakistan as a Muslim-majority country. The result was the displacement of people and violent riots. This painful beginning set the stage for a troubled relationship, which has continued to this day. The British Empire, leaving behind conflict that rages for decades, is a common occurrence, such as the issues in Palestine.
The ruler of Kashmir, a Hindu, chose to join India, even though most people living there were Muslim. Pakistan disagreed with this decision, and the two countries went to war over it in 1947. Since then, India and Pakistan have fought several wars, mostly over Kashmir, and the disagreement continues to bubble along.

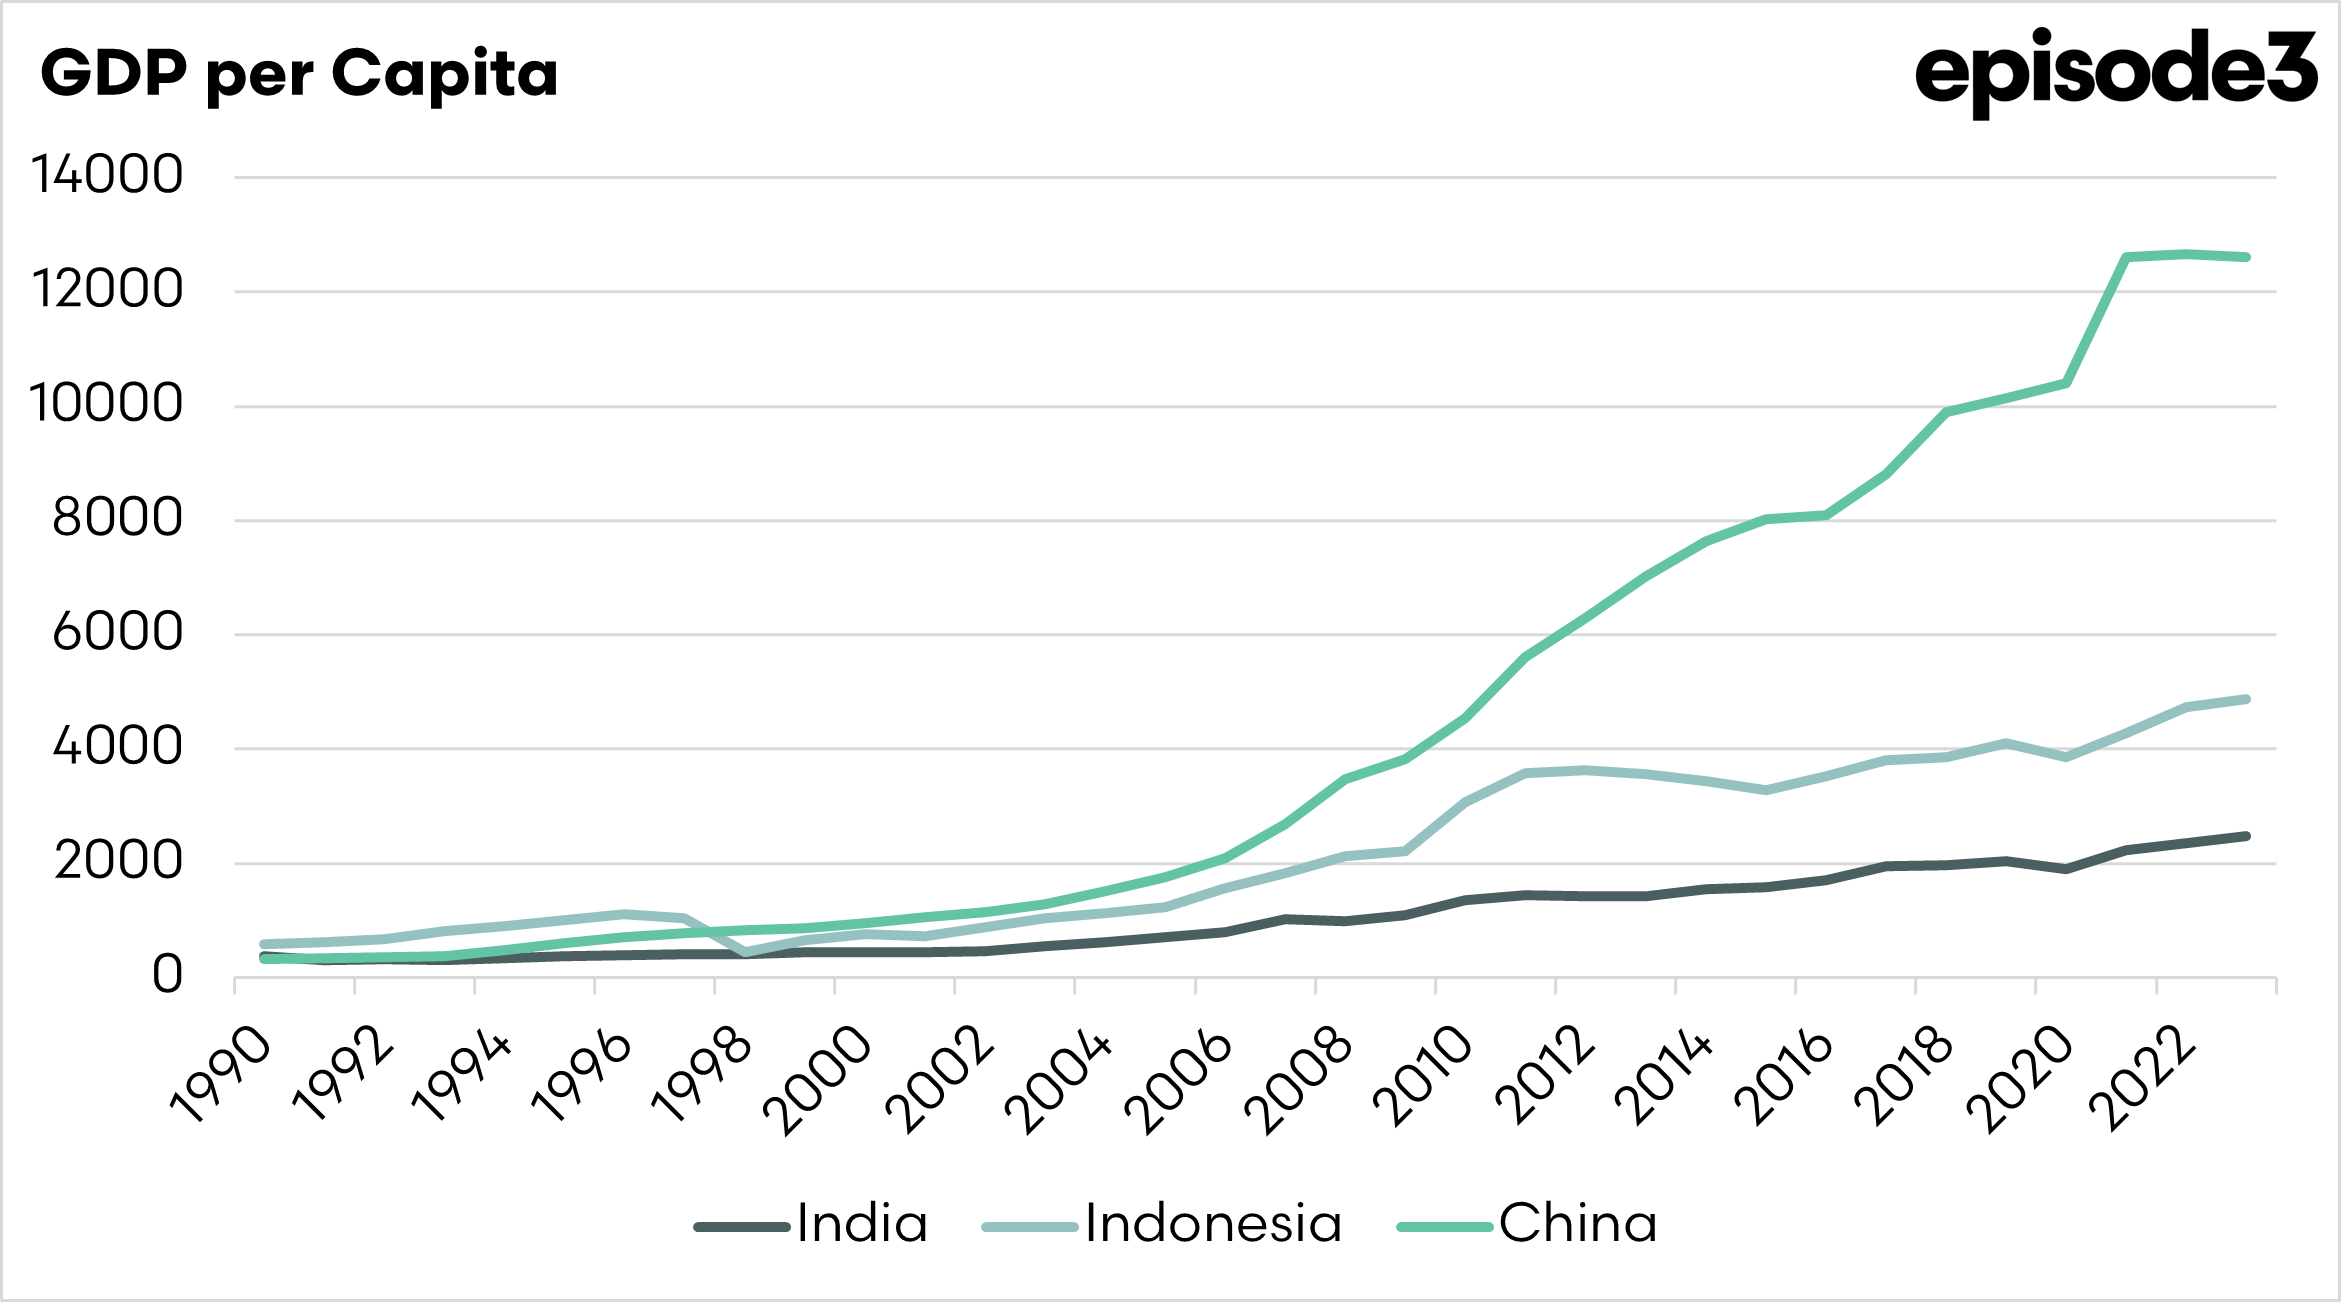
GDP per capita is a useful indicator of how much money, on average, each person in a country produces or earns. It’s calculated by dividing the total value of everything the country makes by the number of people living there.
This number gives a rough idea of how wealthy people in the country might be, and how much they might be able to spend. For example, a country with a high GDP per capita usually means that people have more money to buy products.
It doesn’t show how money is shared between rich and poor people; the Gini coefficient is a better measure for equality, but it’s still a helpful indicator of a country’s general spending capacity. Generally, a higher GDP per capita usually means people can afford to spend more, which is why it’s often used to judge how strong a market for exports could be.
The Indian GDP per capita has been gradually growing for much of the past decade, and although it still remains below that of Indonesia and China, it is a prospect for growth. As the population increases, its disposable income, they are more likely to purchase higher value food products.

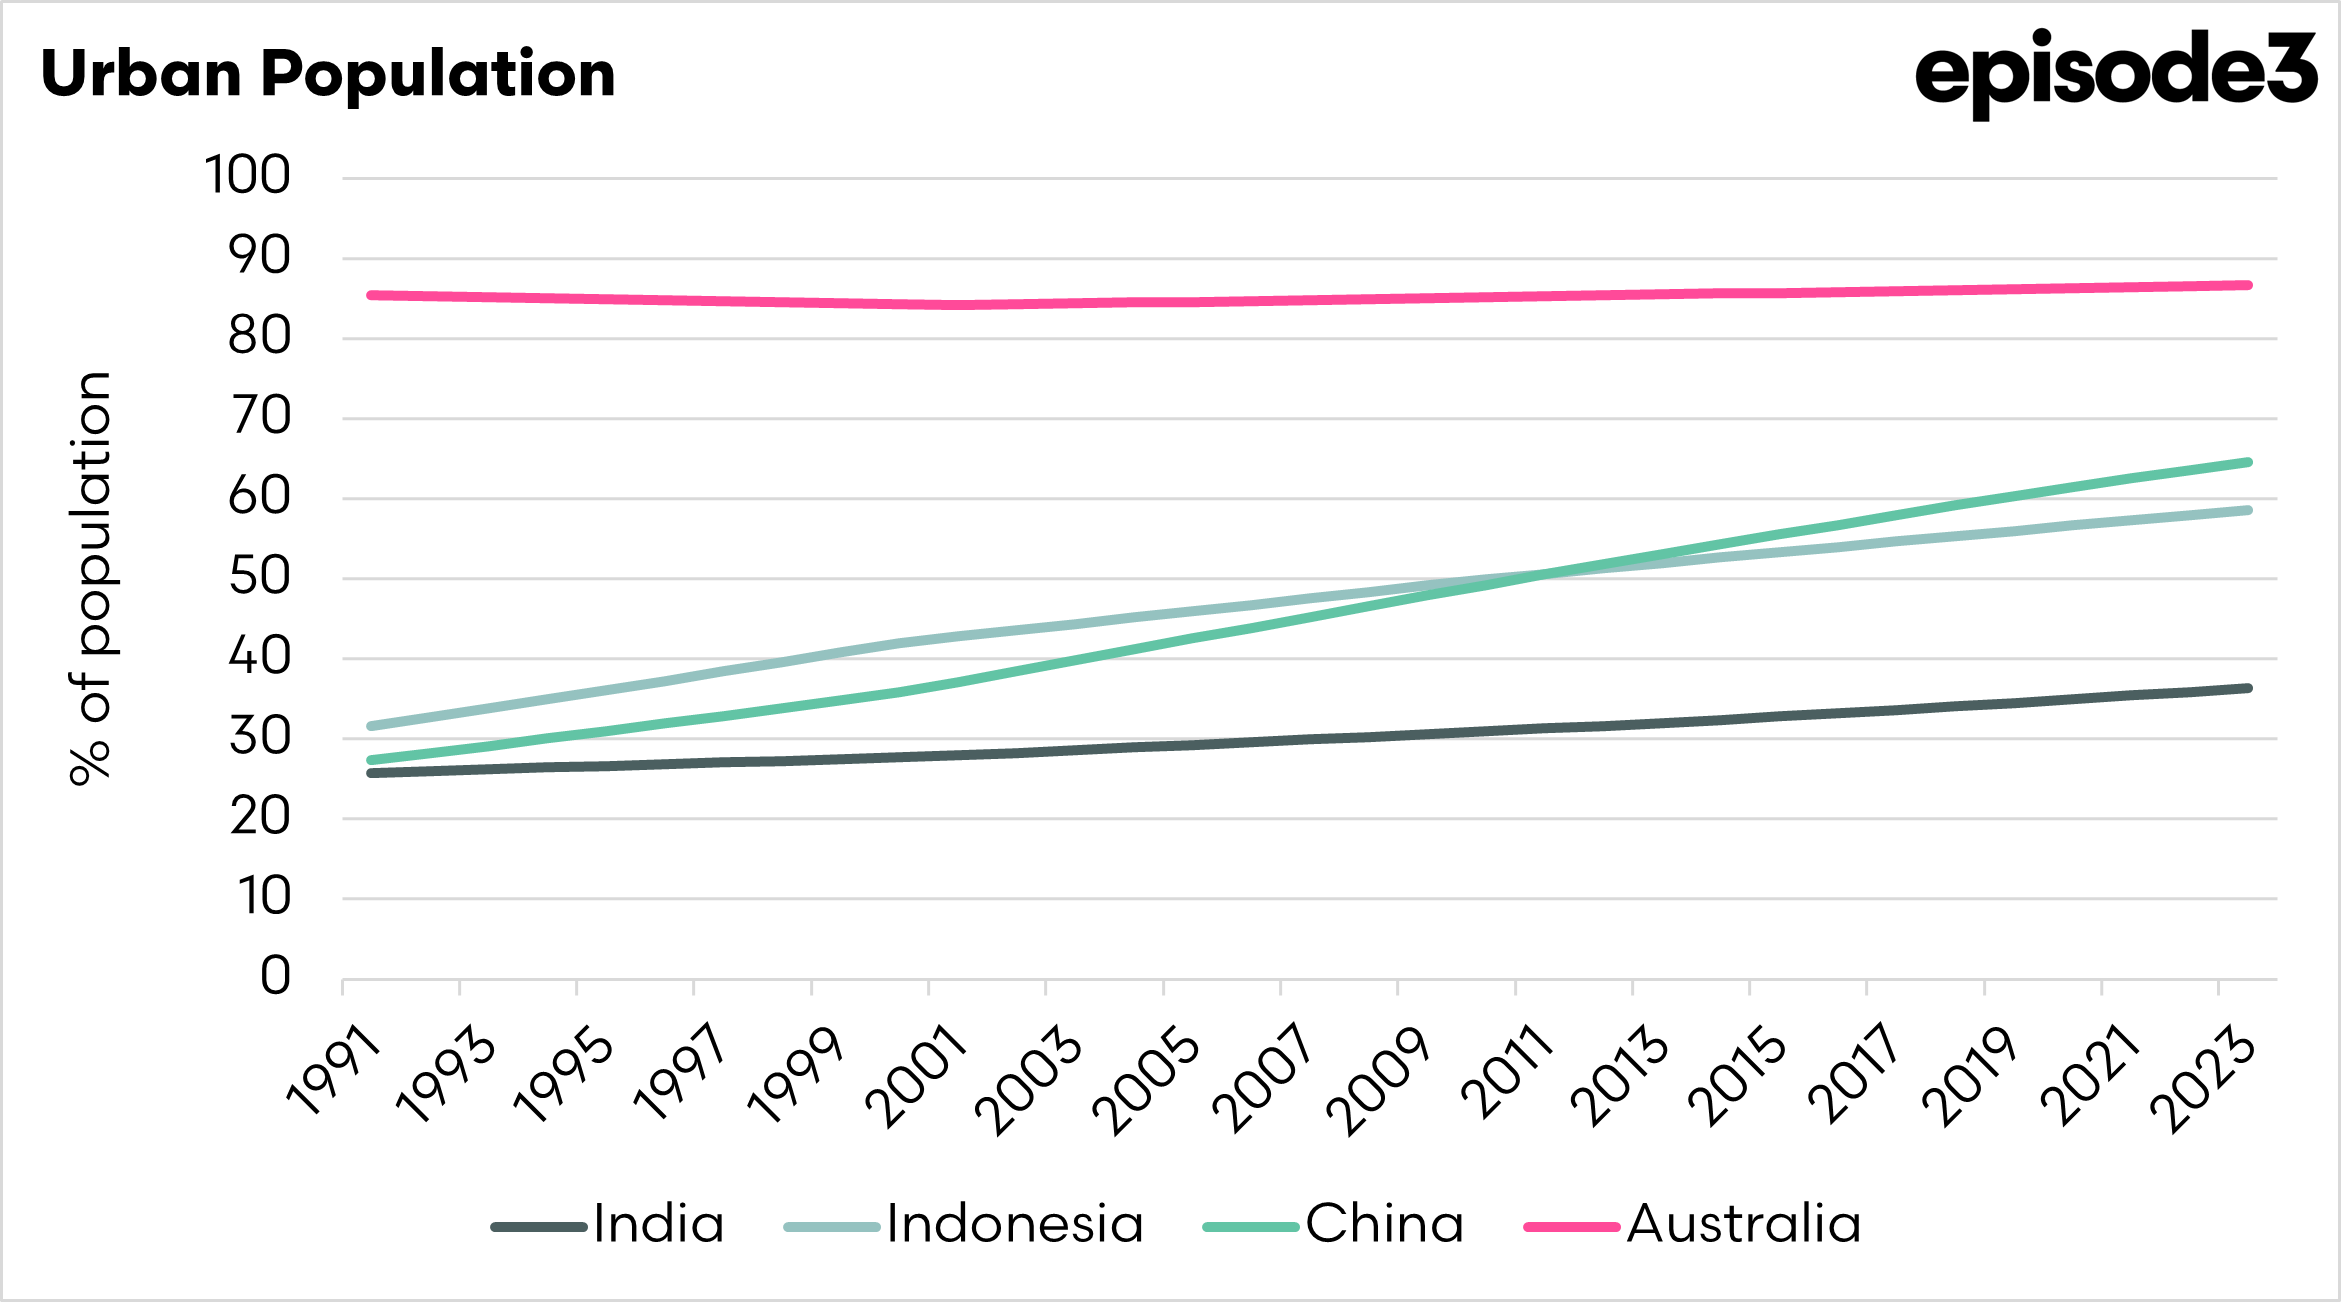
The urban population of India has been steadily increasing, and this is also good news for ag imports. Urban consumers tend to have changing dietary needs (more protein) and higher spending habits than those in rural areas.
Incomes rise as people move into urban centres. This population wants a diverse and high-quality diet, luckily Australia is in a good position to supply this.
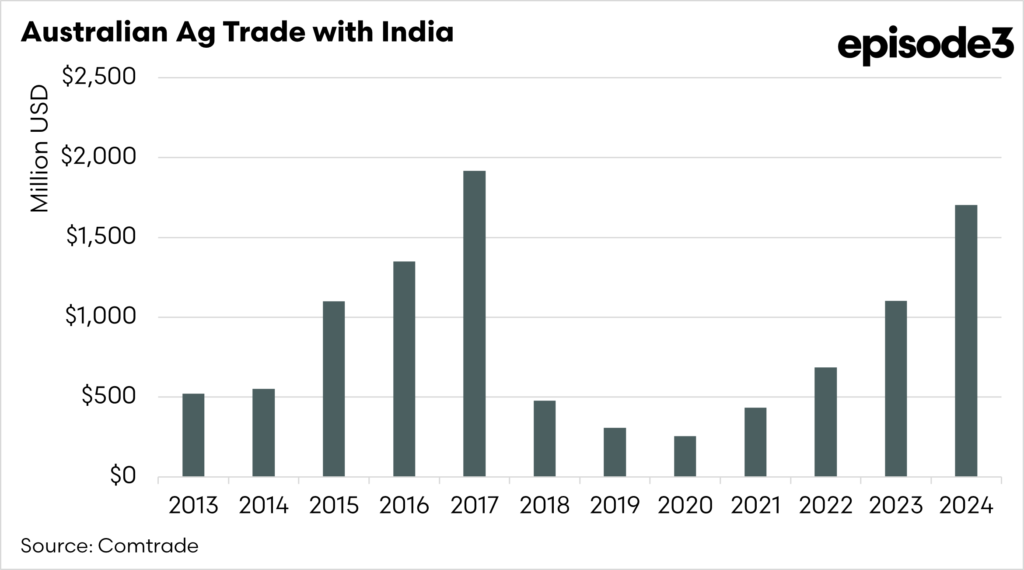

The Australian agricultural trade with India has been growing in the past couple of years, although it did not hit the peaks achieved in 2017, when India experienced a drought from 2016 to 2018.
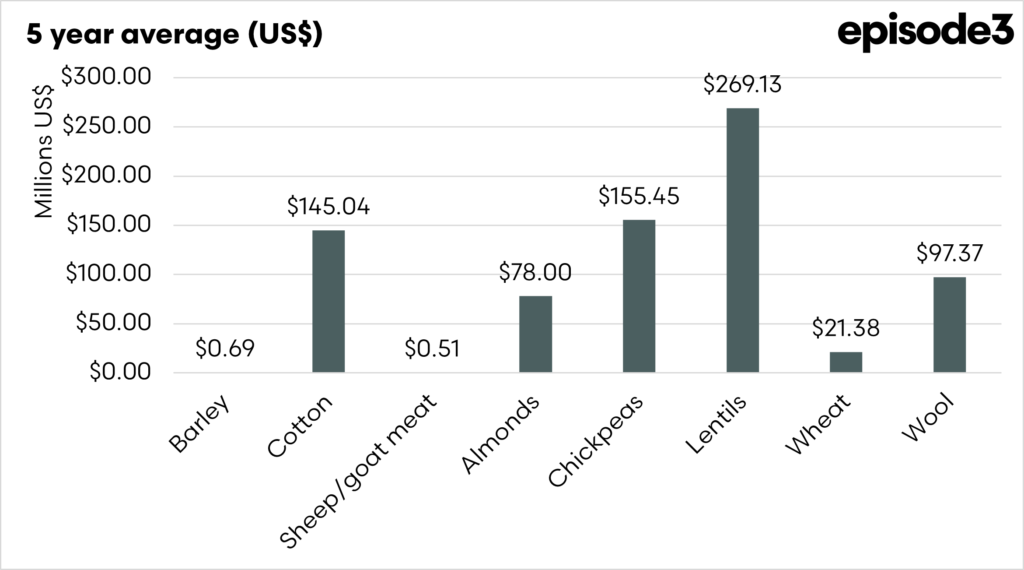
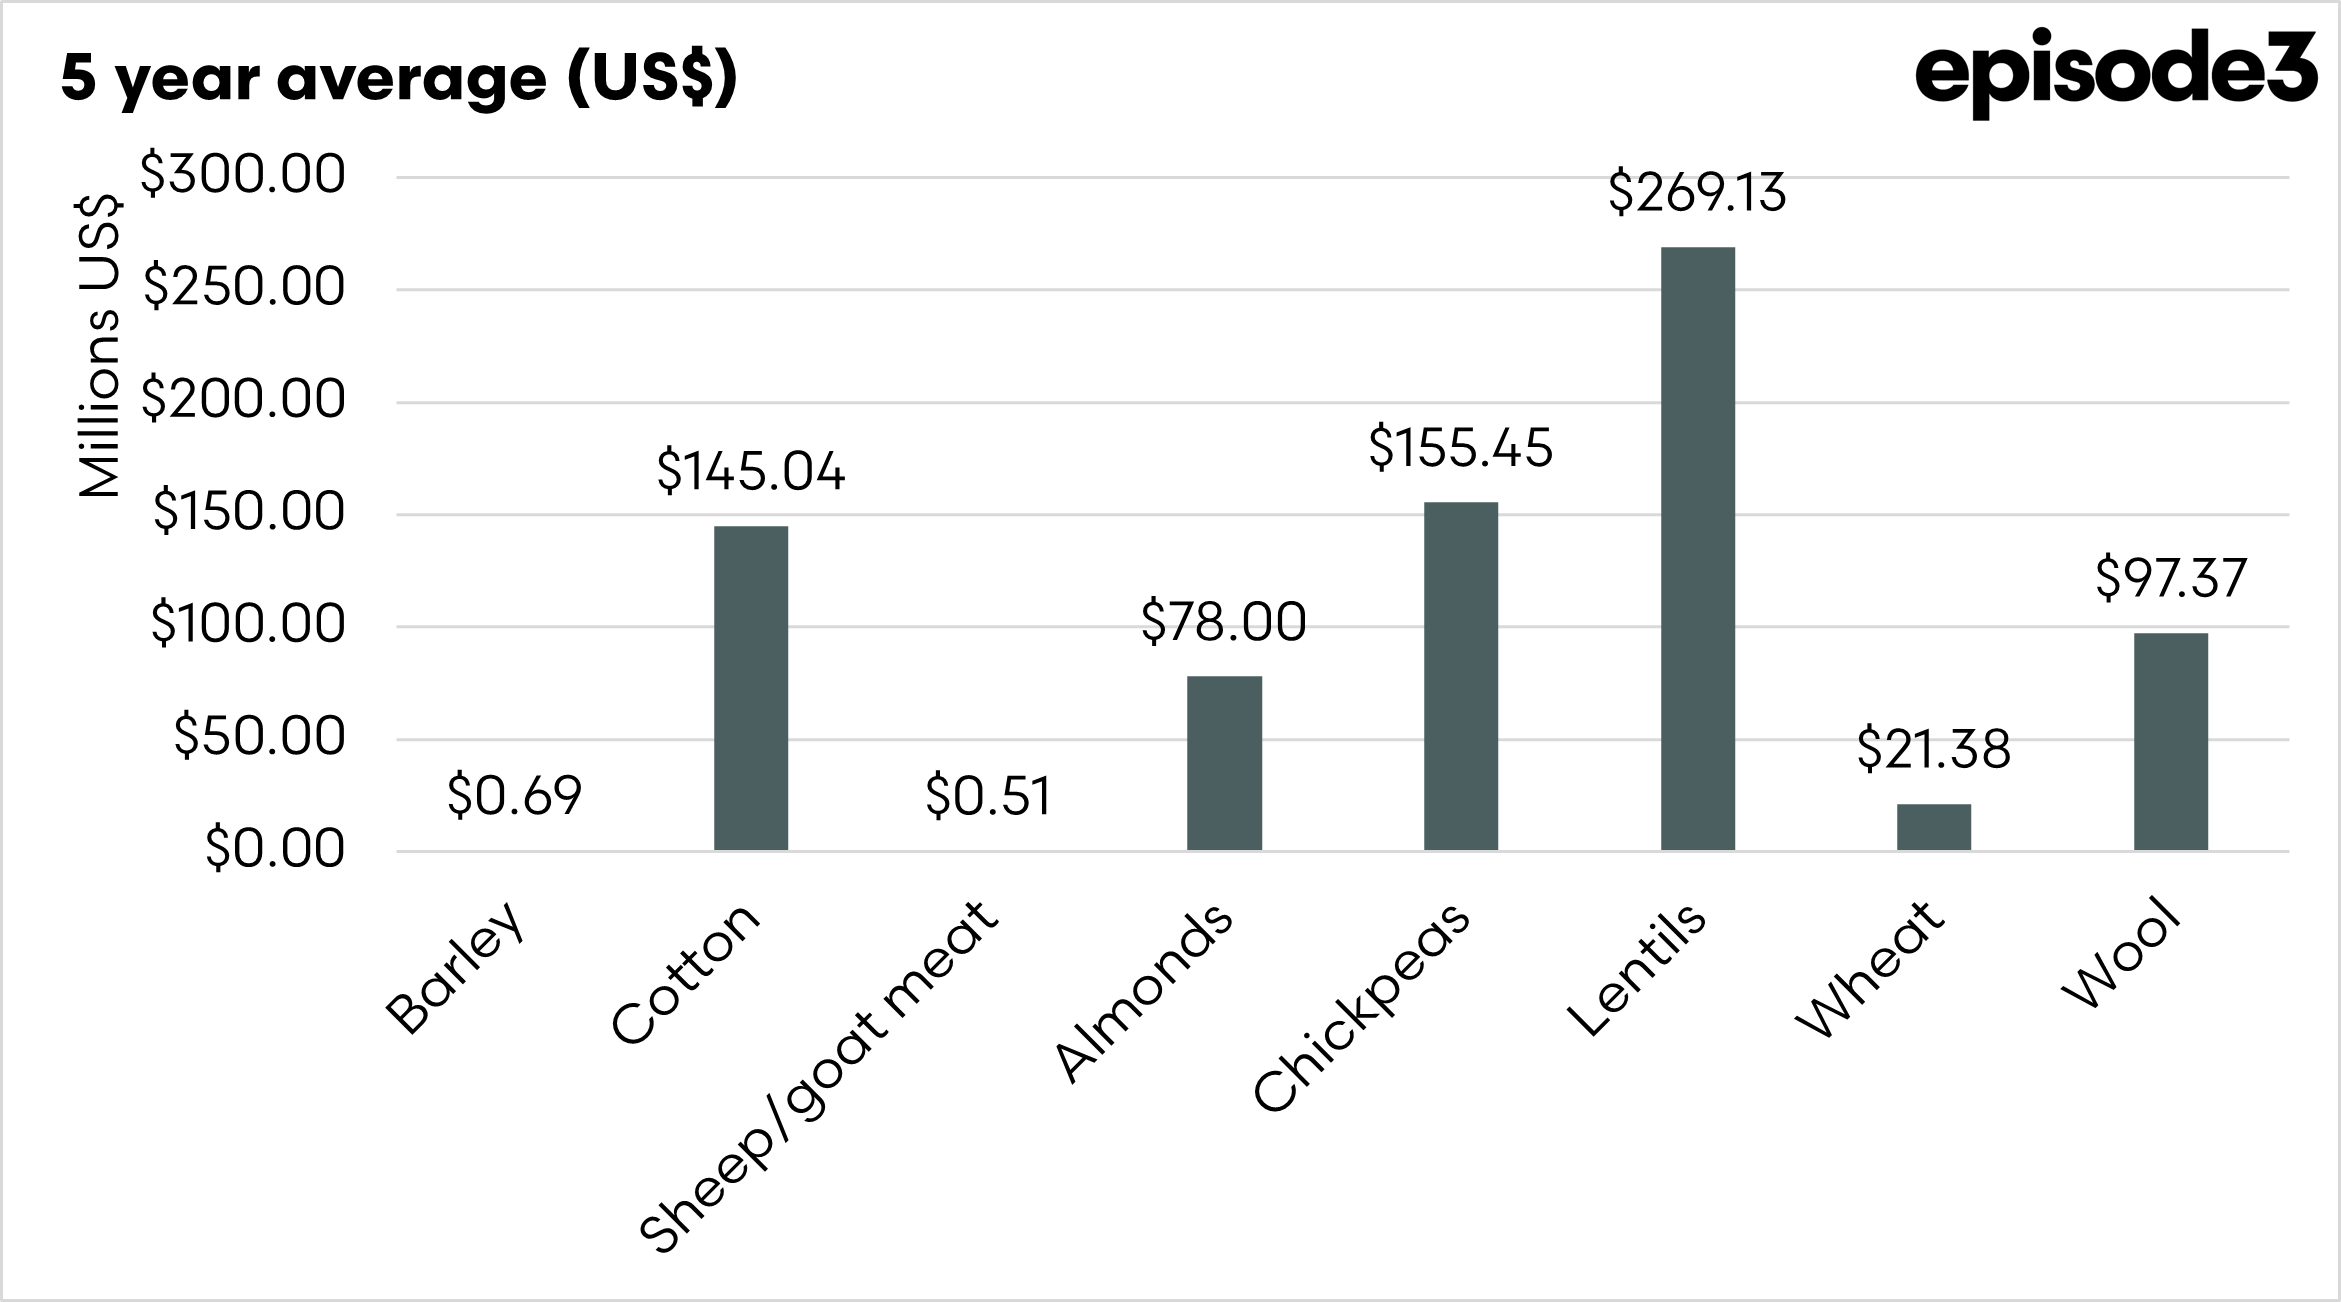
In 2024, Australia traded US$1.7bn with India. The agricultural commodities used in this analysis were Almonds, sheep/goat meat, lentils, chickpeas, wheat, barley, wool, and cotton.
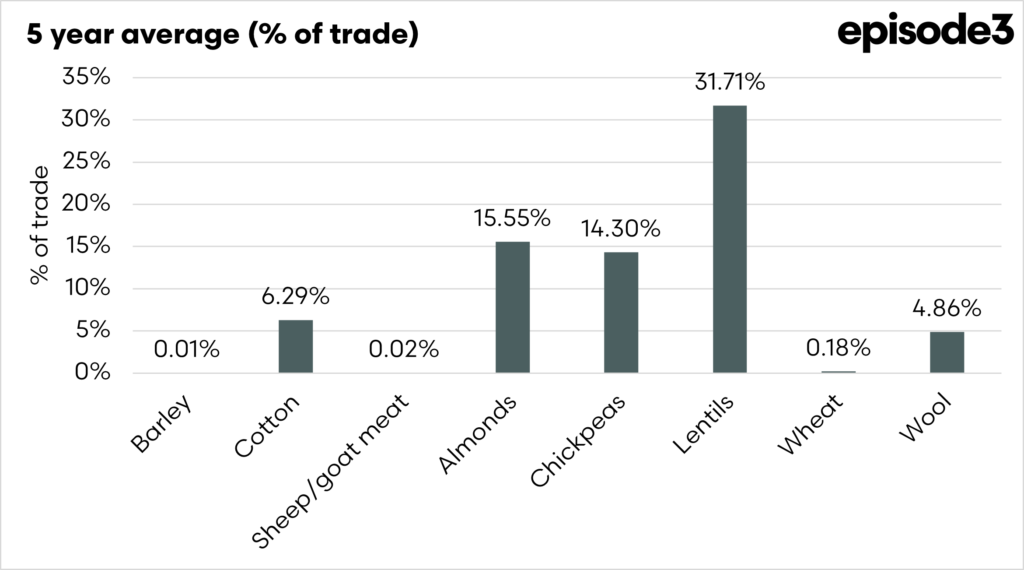
What is our ag trade comprised of?
Unsurprisingly, our biggest trade with India is lentils, my favourite type of curry, the good old dahl. This is followed by chickpeas, cotton, wool, and almonds.
We don’t have a significant reliance on India as a trading partner. Lentils are the highest, with upwards of 50% of exports going there in some of our recent years.
At EP3, we believe that sheep meat, a tiny part of our trade with India, will be a huge growth opportunity. It barely ranks as a mention at the moment, but the potential is there. As GDP per capita grows, meat and protein consumption tend to rise.
A major war?
A major war between Pakistan and India could result in reduced trade. A major conflict has the potential to significantly reduce economic activity and cause the recent increases in GDP per capita to stall. An armed conflict makes trade with a nation far more risky, and some traders would be reticent to trade large volumes of our commodities.