Market Morsel: Deciles of commitment

Market Morsel
This morning I wrote a short piece on the current state of the mind of the speculator (see ‘Speculators add spice’).
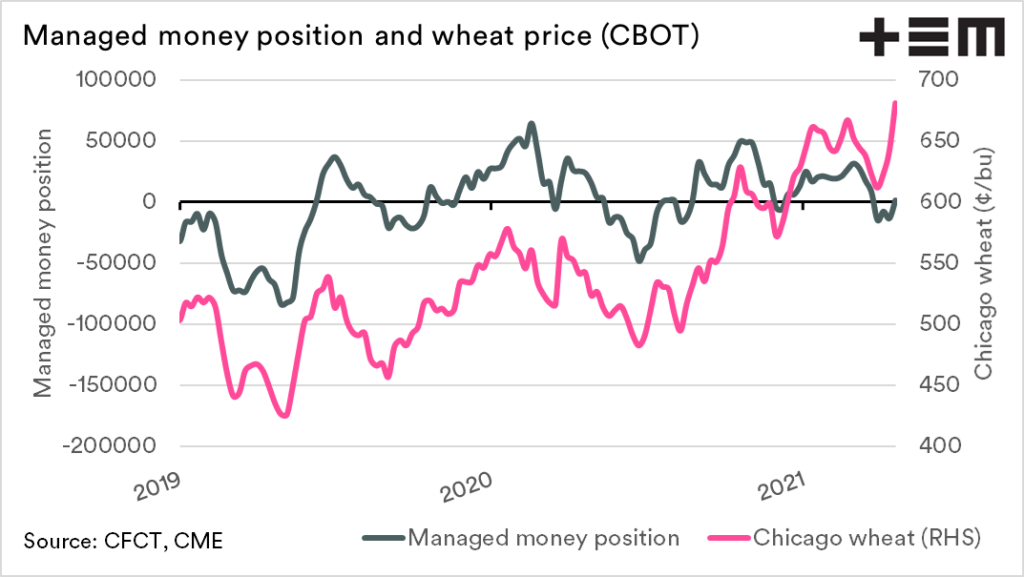
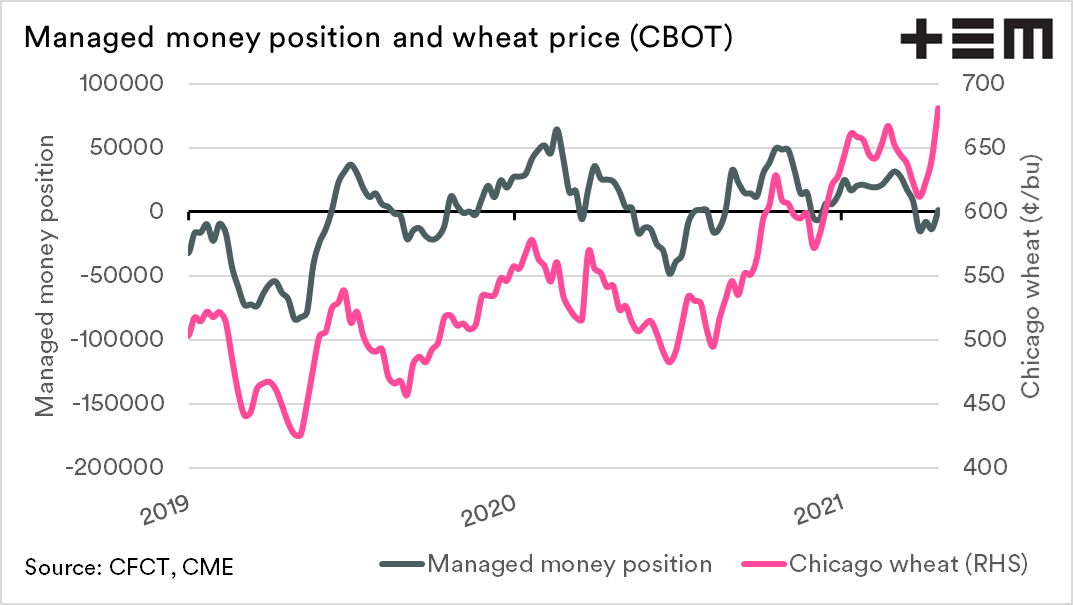
When analysing the commitment of traders report, one of my favourite charts is the management money (speculator) position versus price. The two tend to have a close relationship (correlation 0.68), which makes sense, as speculators pile on when the price is rising and sell when falling.
It got me thinking about how to look into this a little further. As we have been recently updating decile tables for various commodities, I thought about looking at trade positions through the lens of the decile.
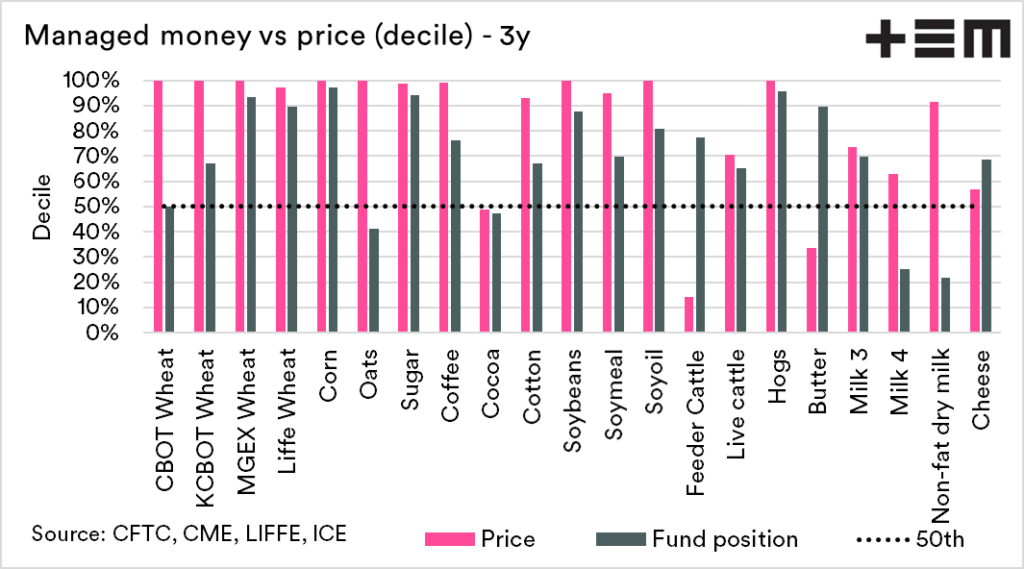
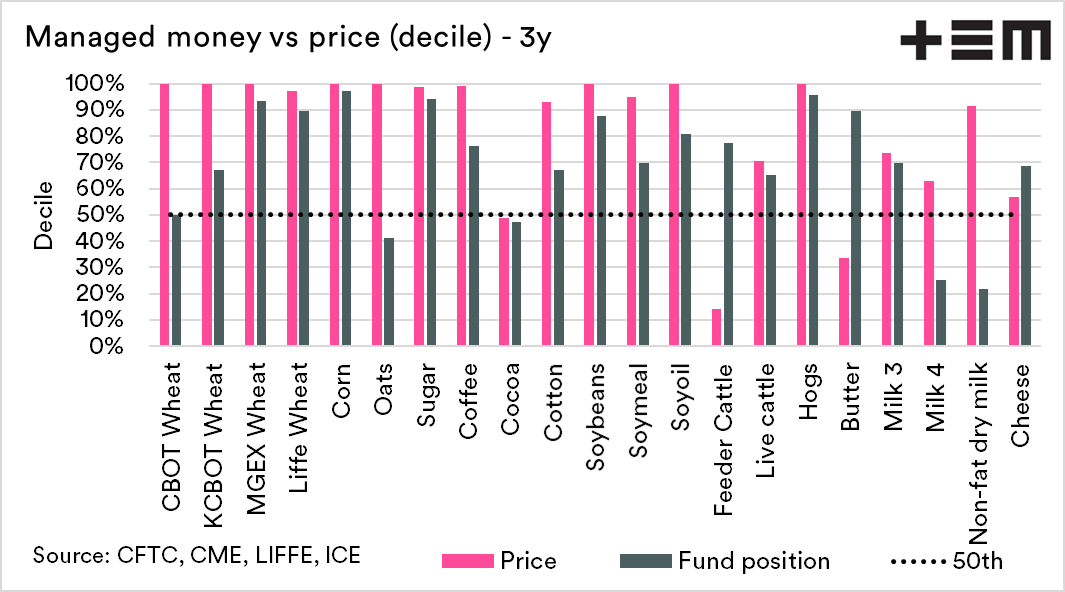
If we are going to look at one commodity, we might as well look at a whole bunch of them. The charts below display decile ranking for both the net position of the funds and the underlying commodity price.
Most know what a decile is, but in its simplest form, a decile of 100% means the highest for the timeframe, and 0 means the lowest. I have chosen to cover a three-year time frame, but if you’d like to see different time frames –drop me an email or tweet.
A 50th decile line is included for quick reference. Any figures above this line start to move towards expensive (price) or heavily bought (COT report). A decile below the line corresponds with cheaper (price) or heavily sold (COT report).
As an example, we can see that the corn price is extremely well bought by speculators, but also is at an extreme price. On the other hand, Wheat is at the 100th decile for pricing but only the 50th decile for speculator position. Does this signal more room for speculators to join the wheat party?


