Wool Market Update – Sept 2026

Wool Market Update September 2026
August into September: six weeks at a glance
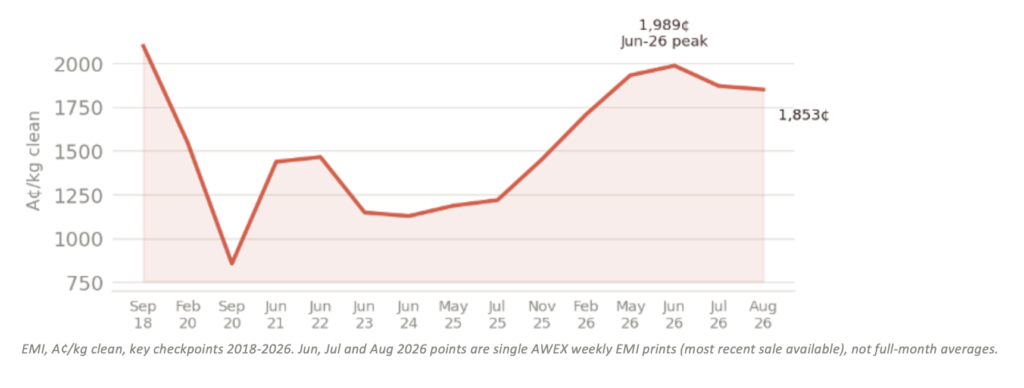
This update covers the six weeks from the start of August through the week 11 sale, closed 10 September: a season high, a pullback, and now a market holding its gains. The EMI drifted from June’s 1,989¢ peak (week 51, 16-17 June, just 11¢ short of the 2,000¢ mark) down to 1,853¢ by the end of August, bounced 26¢ in the first sale of September to 1,879¢, then eased 12¢ to 1,878¢ in the week 11 sale. Demand-side indicators held up right through the period, China, Italy and Japan’s manufacturing PMIs stayed in expansion and the AUD/USD rate firmed further to around 72.3¢ (on the AWEX EMI buy rate for the week 11 sale, up from 71.7¢ on 1 September), so the September pullback reads as consolidation after a strong first half rather than a change in direction. The one thing to watch: 21 micron has dropped through its nearest support level and 20 micron is sitting right on top of its own, both bands warrant a closer look next sale.
A quick word on the indicators below before the detail: a Purchasing Managers’ Index (PMI) is a monthly survey of factory managers, combining new orders, production, employment, supplier deliveries and inventories into a single reading. A reading above 50 means that sector is expanding, below 50 means it’s contracting. HMI watches the PMIs of Germany (via the Ifo Business Climate Index, a similar survey-based gauge), China (RatingDog) and the US (ISM) most closely, together they statistically explain roughly 59% of the movement in the Eastern Market Indicator (R² = 0.59), a stronger relationship than wool supply itself, because wool demand follows global factory and consumer confidence more than it follows anything happening in Australia.
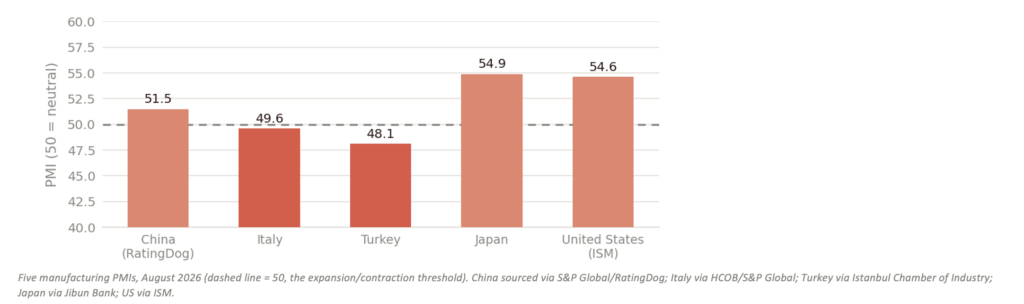
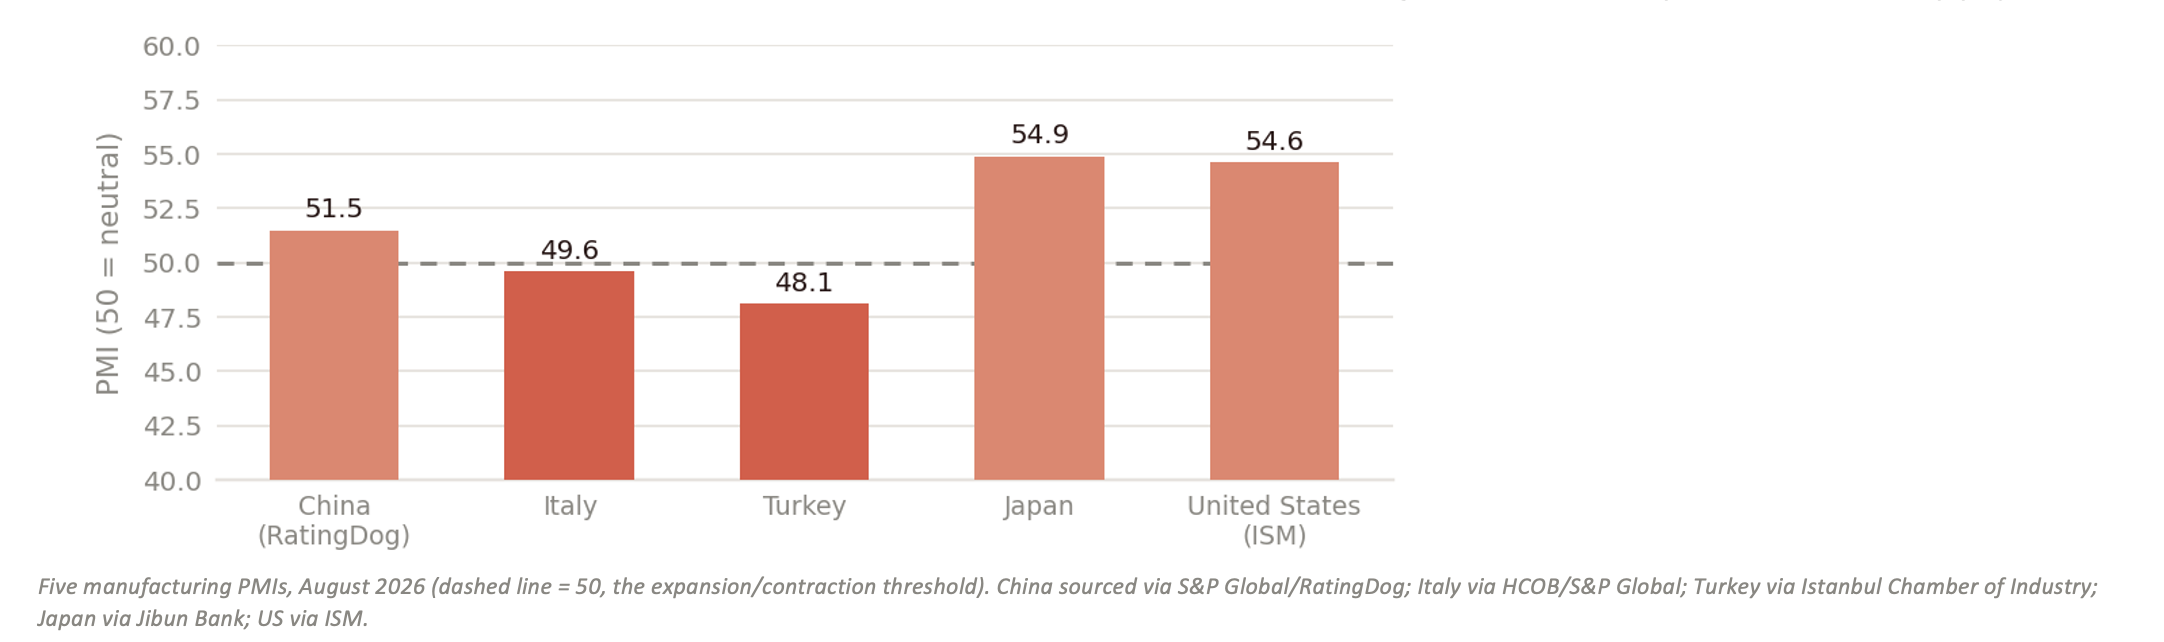
The demand backdrop kept broadening even as the EMI eased back from its June peak. Germany’s Ifo Business Climate Index climbed to 88.8 in August, up from 86.6 in July, and Japan’s manufacturing PMI held at 54.9 for an eighth straight expansionary month. The US ISM print came in at 54.6 for August, an eighth consecutive month of expansion, and China’s RatingDog PMI climbed to 51.5, a two-month high, with new orders extending their run of consecutive monthly growth into a 14th month, the longest since 2018. Not every reading agreed: Italy slipped back into contraction at 49.6 and Turkey stayed there at 48.1, a reminder that this recovery is broad but not universal.
The EMI itself eased from 1,989¢ at its 17 June peak to 1,853¢ in August, before ticking back up to 1,879¢ in the first sale of September (+26¢ on the week). That pattern, a strong first-half rally followed by a gentle late-winter easing rather than a reversal, is consistent with a market consolidating a genuine gain, not giving it back.
Tariffs moved through the period too, and the picture has firmed up since. China cut its own import tariffs on wool effective from 1 January 2026 (raw/scoured wool 6% to 1%, combed/top-spun wool 8% to 3%), a direct cost saving for the mills that buy roughly 88% of Australia’s clip. In late August, Bloomberg reported Washington was weighing a new 7.5% “overcapacity” tariff on Chinese goods ahead of Xi-Trump talks; by 10 September China’s Commerce Ministry said it hopes to agree reciprocal tariff reductions on US$30 billion of goods each side “at an early date,” with Trump and Xi due to meet in Washington on 24 September and the current tariff truce running to 10 November. Nothing is signed yet, so this stays a live risk rather than a settled fact, but the direction of travel through the period has been toward de-escalation, not away from it. Oil firmed back to around US$87 a barrel by late August as the Strait of Hormuz situation stayed heavily restricted, a reminder that geopolitics remains the market’s main downside risk.


Why watch factory surveys in Germany, China and the US?
Around 90% of Australia’s wool clip leaves the country, almost entirely unprocessed, so the price paid at auction is set by what overseas mills and shoppers are doing. Wool is also discretionary: a Merino jumper is bought when consumers are confident and deferred when they are not. Analytics firm Episode3 built a “Global Growth Index” from the Chinese PMI, the German Ifo index and US output per person, and found it statistically explains about 59% of the movement in the Eastern Market Indicator (R² = 0.59), a stronger relationship than wool supply itself.
Based on my own calculations the strongest relationship between US manufacturing and the EMI is same-month, at +0.77. US activity moves together with the EMI rather than predicting it, still one of the more useful single series I’ve seen in my correlation testing.
Boom, bust and recovery: why the EMI is where it is
The EMI set its record of roughly 2,100¢ in September 2018 during a rare episode of synchronised global growth, then collapsed to 858¢ by September 2020 as COVID shut suits, formalwear and travel wardrobes out of the shopping list. A three-year slump followed (2022-24): European energy costs spiked after Russia’s invasion of Ukraine, Chinese zero-COVID lockdowns and a property downturn crushed confidence, and the US Federal Reserve’s fastest rate-hiking cycle in four decades pushed American manufacturing into contraction. The EMI drifted in the low-1,100s to mid-1,200s through most of 2023-25, the slump growers remember.
Four forces turned the cycle from late 2024: interest rates came down (the Fed cut 175 basis points, the ECB cut from 4.0% to 2.0%), China stimulated its economy from September 2024, Chinese mill destocking ended after two years of running down inventories, and European energy costs normalised, down roughly 85% from their 2022 peak. The result: the EMI broke 1,700¢ in February 2026, passed 1,900¢ in May, and peaked at 1,989¢ in the week 51 sale (16-17 June 2026), just 11¢ short of the 2,000¢ mark and its highest since October 2018. Part supply story, part demand story: the national flock is at its smallest since 1904, so both blades of the scissors are cutting (more on that below).
Micron spread, and the ten-year story in dollars
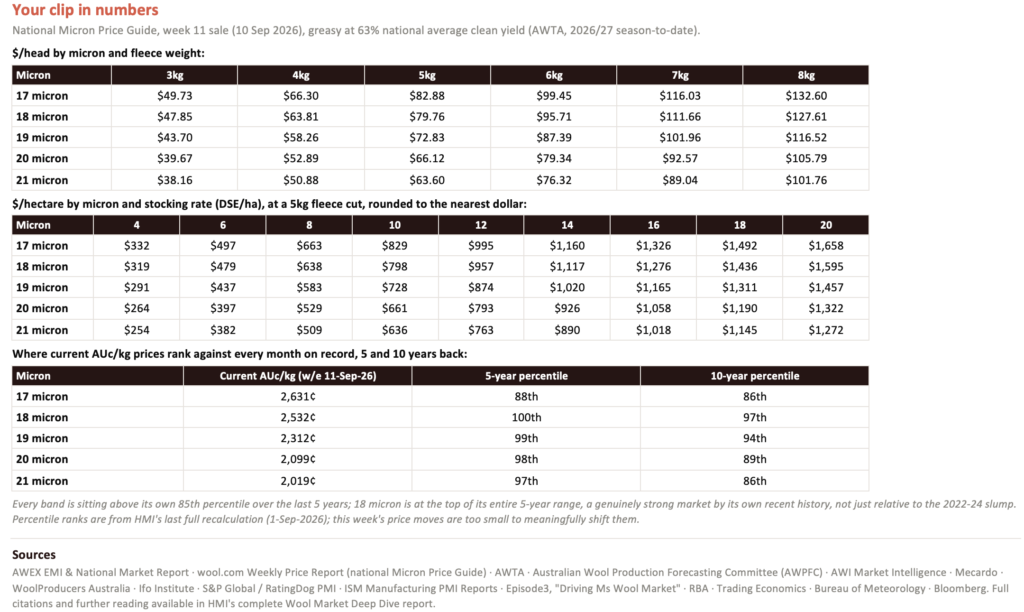
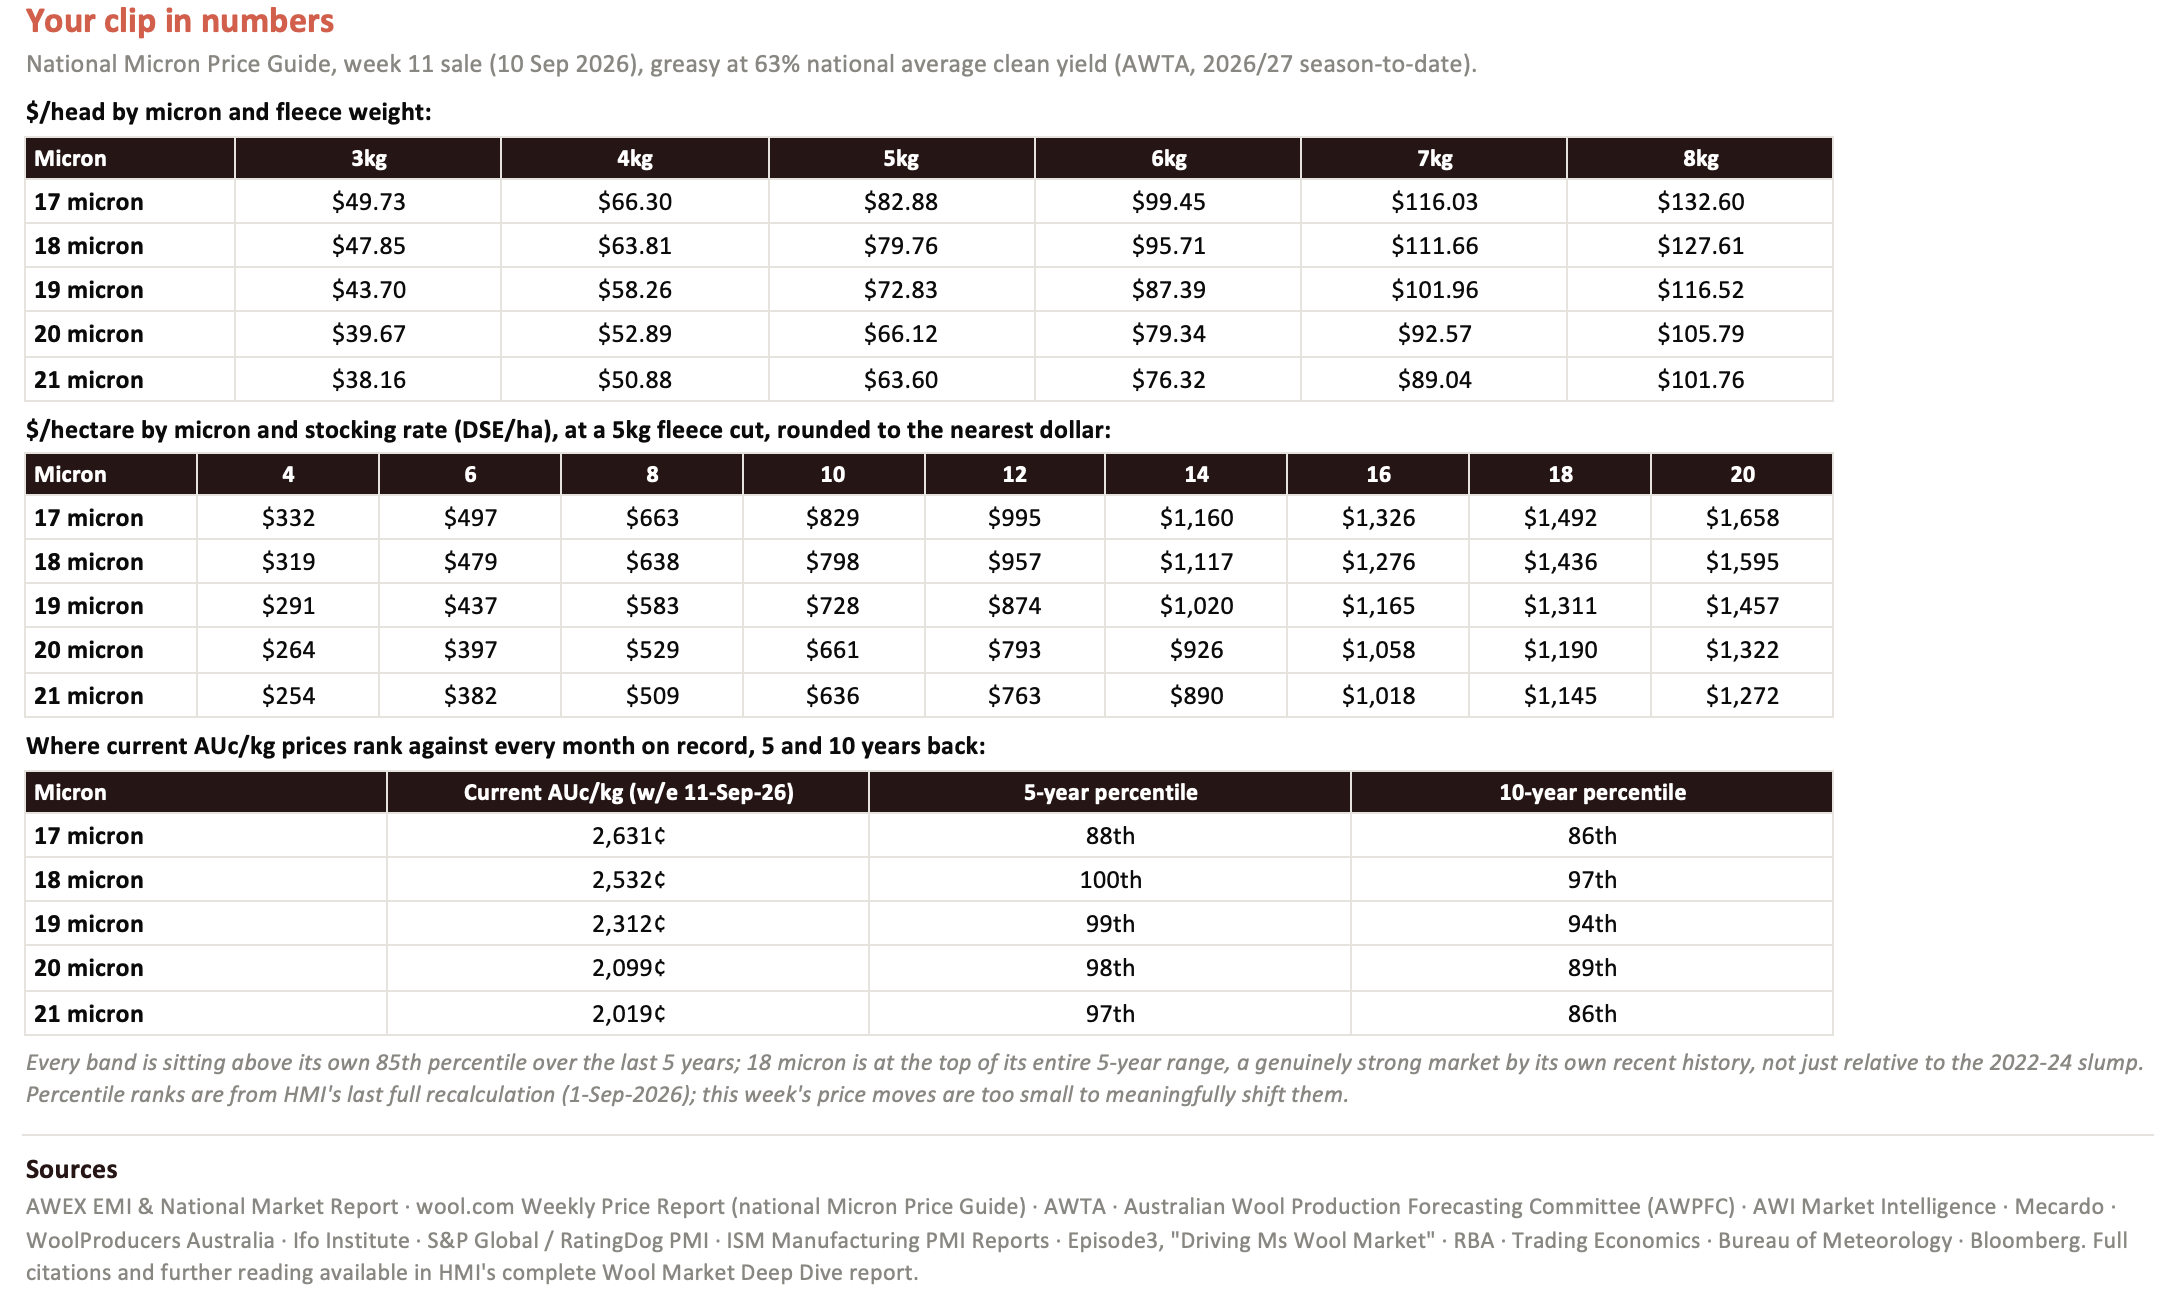
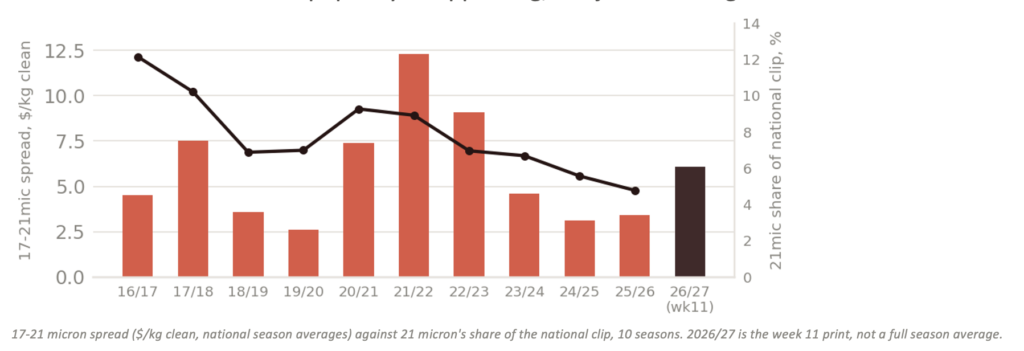
The 17-21 micron spread has widened to 612¢/kg clean (17mic 2,631¢ vs 21mic 2,019¢, week 11 sale, 10-Sep-2026), or 30% on top of the 21mic price, up from 563¢ (27%) a fortnight earlier. That widening has come alongside a shrinking 21 micron offering: the band has fallen from roughly 44,200 tonnes (almost 12% of the national clip) in 2012/13 to around 12,200 tonnes (under 5%) in 2025/26, a drop of about 72% in raw tonnage over 14 seasons. The recent seasons show that relationship at its cleanest: 21 micron volume has fallen every year since 2021/22, and the spread has eased back with it, from 12.3¢/kg that year to 3.4¢/kg now.
The one season that breaks the pattern is 2017/18, when the spread spiked to 7.5¢/kg even as volume was already falling: that season lines up with the strongest globally synchronised manufacturing expansion since 2011 (JPMorgan Global PMI in the low-to-mid 50s, its best run in five years), a demand-side spike rather than a supply story, so I’ve treated it as the exception rather than the rule. Outside that one season, the spread is only now starting to catch up with a decade of the broader end of the clip quietly disappearing, not just shrinking as a share.
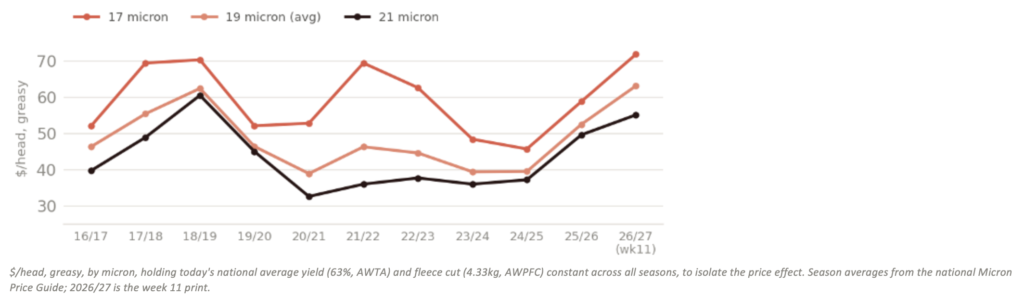
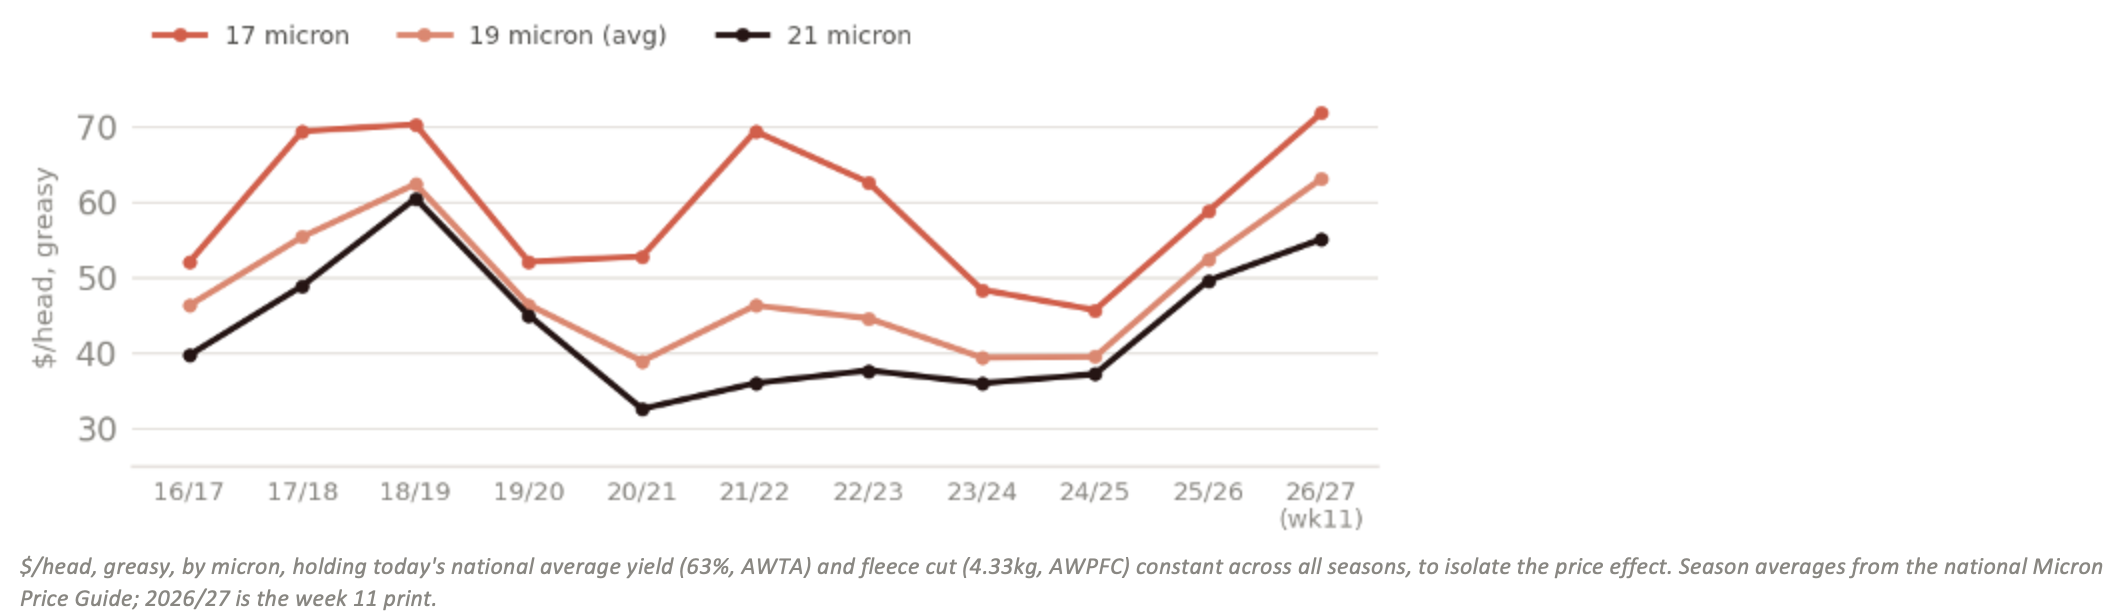
Here’s the number that puts the season in context: shorn sheep numbers have fallen from 180.9 million head in 1991-92 to an AWPFC-forecast 56.3 million this season, the fewest since 1904, and production over the same 35 years from 801 to 249 million kg, both down 69%. South Africa’s clip is on the same trajectory, down 10% in just the last five seasons (Cape Wools SA). And yet the average Australian sheep is paying its way better than it has in a decade: hold today’s national yield and fleece cut constant and run it back through ten seasons of the Micron Price Guide, and both 17 and 19 micron wool are worth more per head this week than in any full season since at least 2016/17, including the 2018/19 peak. 21 micron isn’t quite there, still around $5 a head short of where it sat seven years ago, the finer end of the clip pulling ahead in dollar terms as much as in cents per kilo. Keep in mind that I have based in on a national average wool cut of 4.33kg and a 21 micron usually cuts more than this.
The receivals data backs the same story. AWTA’s national testing volume, the closest published proxy for wool actually reaching the trade, sits at 32.1 million kg this season to end-August, down 2.7% on the same point last year. Quality is steady (20.3 micron, 63.1% yield, 90.0mm staple, 35.7 N/ktex), and national rainfall in August ran 29% above average, heaviest across South Australia, northern Victoria and southern NSW. Less wool, finer wool, a market prepared to pay up for it.
Tariffs, China and the reshuffled trade map
US tariffs sit near their highest average since 1969 (about 11.8% effective, versus 2.3% in January 2025), yet the hard data says tariffs are not the main driver of the strong US PMI. US factory construction spending is down about 21% from its June 2024 peak and manufacturing employment fell after tariffs took effect, while total US goods imports hit a record US$3.44 trillion in 2025. What is driving the PMI: booming orders for semiconductors, AI data-centre equipment and defence. For wool, an expanding US economy still means more clothing bought, whoever makes it.
China’s share of global apparel exports has slid toward 30% as sewing migrates to Vietnam and Bangladesh, but China’s wool processing dominance is intact: it still took 88.4% of Australia’s export volume in the first half of 2025/26, a share that has risen even as clip volumes fell. A fast-growing slice never leaves China at all, Merino apparel sales there rose 18% in the year to July 2025, and AWI estimates China now consumes at least half its wool imports domestically. Much of the wool that does move on now travels Australia to Chinese processing to garment assembly in Vietnam or Bangladesh to US or European retail, a reshuffle of the label, not a loss of the mill.
Our dollar: a headwind in AUD terms, not in demand
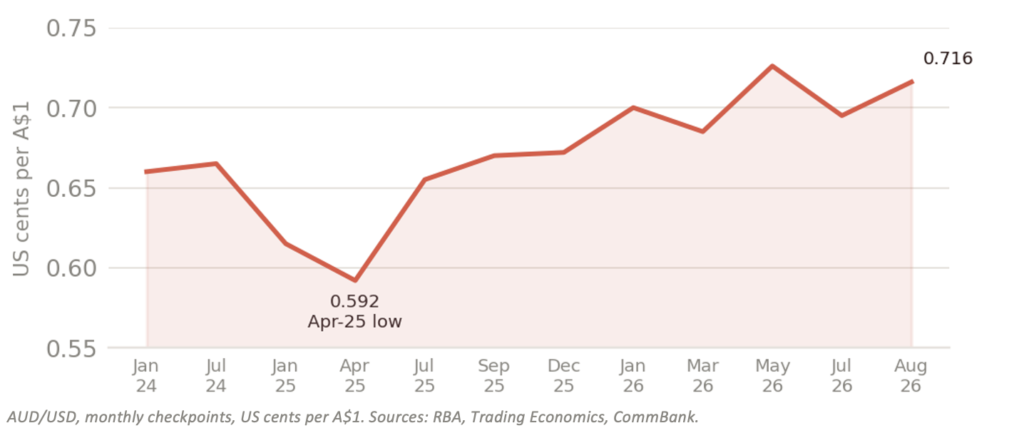
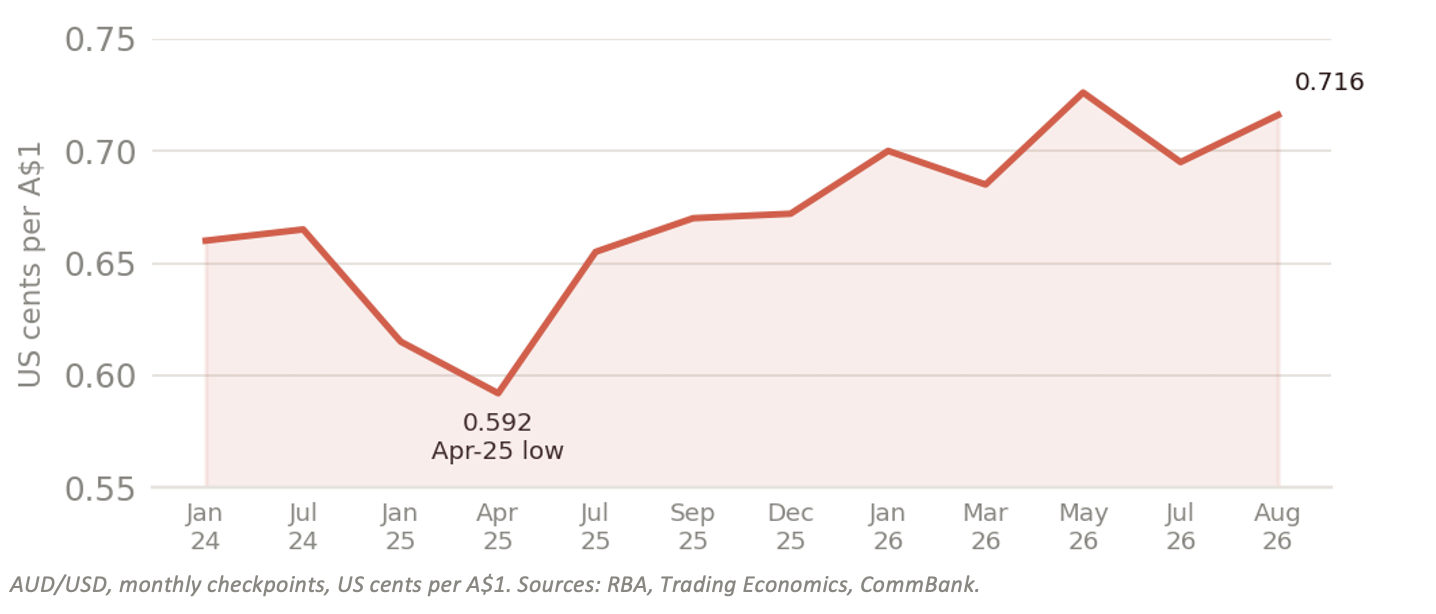
The AUD has climbed from a five-year low of 59.2 US¢ in April 2025 to around 72.3 US¢ by the week 11 sale (10 September 2026), first as a broadly weak US dollar (its worst first half since 1973), then in 2026 as the RBA hiked three times to 4.35% while the Fed held at 3.50-3.75%. The proof this is a currency effect and not a demand effect sits in the two versions of the EMI: on weeks the AUD surged, the EMI has eased in AUD terms while rising or holding in USD terms, exactly what happened in the week 11 sale itself, where the EMI fell 12¢ in AUD terms but rose 8¢ in USD terms. A falling EMI on a rising dollar is not the same thing as falling demand.
Geopolitics: the market’s main downside risk
Two live risks remain the biggest swing factors. The Red Sea route is still open but disrupted, Houthi attacks continued into August, and vessel traffic through Bab el-Mandeb is still down roughly a quarter on pre-crisis levels. The Strait of Hormuz stayed heavily restricted through August following February’s escalation, and oil firmed back to around US$87 a barrel by late August after briefly spiking above US$126 in April. Despite this, the EMI rose roughly 42-62% year-on-year through the period, tight supply and the demand recovery have so far outweighed the conflict headwinds, but any resolution in Hormuz or Ukraine would likely show up as lower energy costs, cheaper freight and firmer discretionary demand.
What this means at the shed
Wool prices are being lifted on both ends of the scale. Global supply is the tightest in decades, with Australia’s own flock at its smallest since 1904, and the demand recovery is real: the US is expanding at a four-year-high pace, China’s mills are in their eighth month of expansion with historically low inventories to rebuild, and Germany is improving from a low base. The strong Aussie dollar is skimming some of that off the top in AUD terms, and geopolitics is still the biggest thing that could go wrong. But with Australian, NZ and South African production all near record lows at once, even modest demand growth meets genuinely scarce fibre. That’s the structural case for wool over the medium term, not just this season’s rally.
What to watch from here
• Monthly: Ifo (late month), RatingDog PMI (1st), ISM PMI (1st business day), new orders components lead mill wool buying.
• Weekly: the EMI in both currencies. USD-terms strength on AUD-terms weakness is a currency effect, not demand weakness.
• Turning points: the Trump-Xi summit in Washington on 24 September and whether the flagged $30bn/$30bn tariff cuts get signed, the RBA’s 29 September decision (markets are pricing a real chance of a fourth hike, to 4.60%), the Fed’s own meeting this week, Chinese mill inventories refilling, and any Hormuz or Ukraine resolution.