A good start, let’s not falter.

The Snapshot
- The wheat market has experienced an explosive rally during recent weeks.
- I was asked whether it was rare to see strong rallies in the lead to harvest.
- It is not exceptionally rare, to have a 4th quarter rally in wheat pricing. However, it is almost equally common to see a fall.
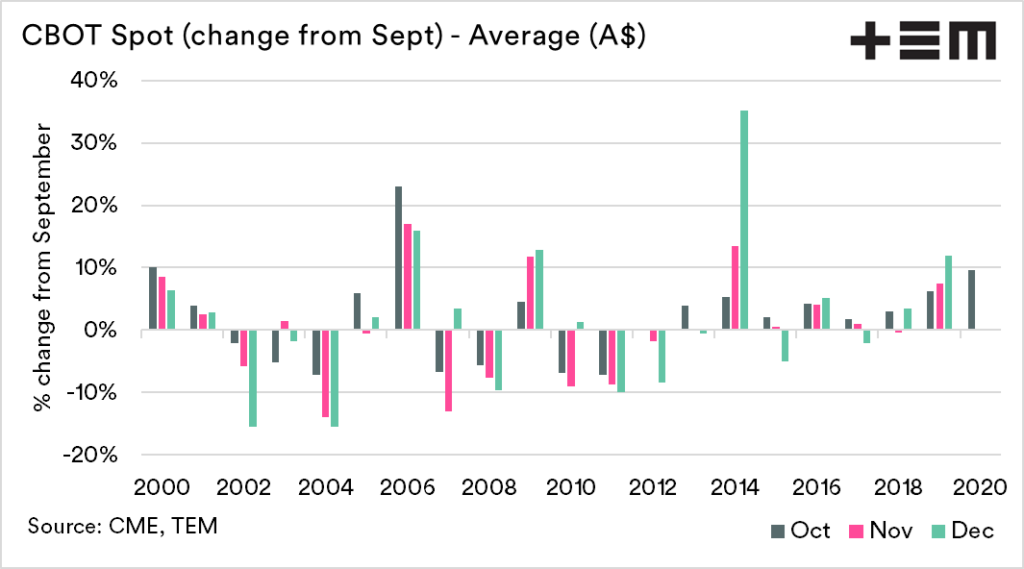
- The surprise is how much the A$ has impacted upon pricing at this time of year, in
- The largest rise from Sept to Dec has been +35% (2014), and the largest fall has been -16% (2004).
The Detail
The wheat market has been fortunate to Australian farmers in recent times. We have now experienced four consecutive weeks of rises, and out of the past eight weeks, we have only had one week in the red.
This is excellent news as we head towards harvest and a good one at that. The upwards move in the market has been driven almost exclusively by events occurring overseas.
I was asked over the weekend on Twitter (see here) how often that CBOT futures converted into A$ had rallied before or during the Australian harvest.
This was an interesting question. Seasonally most of the determination of price occurs during the May-August period (see here & see here). In simple terms, this is when the grain of the world is grown, and if an issue arises, that is when the most impact will be felt.
So logic would dictate with the majority of the world finished, that price rises would be rare. Let’s take a look into the data.
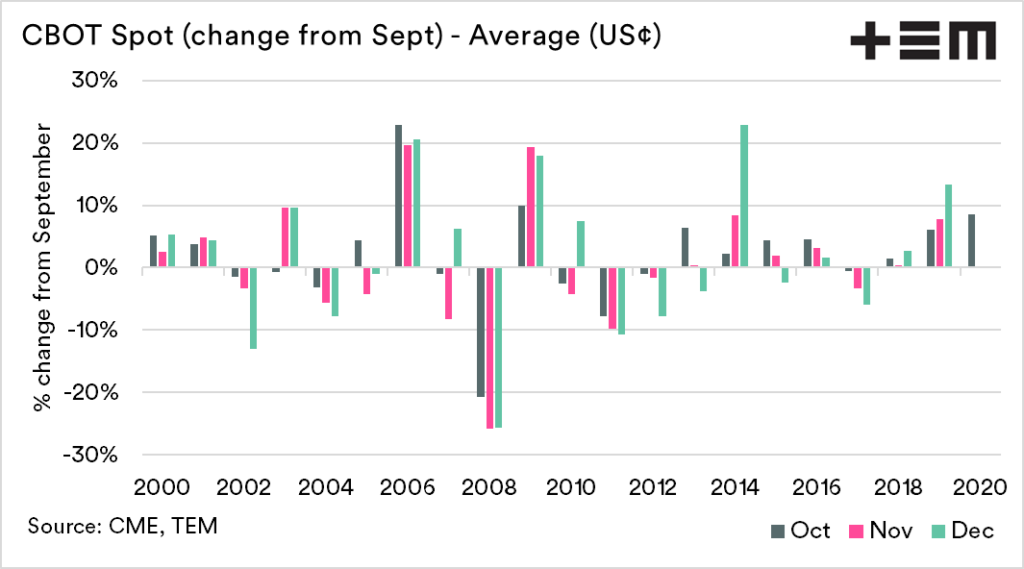
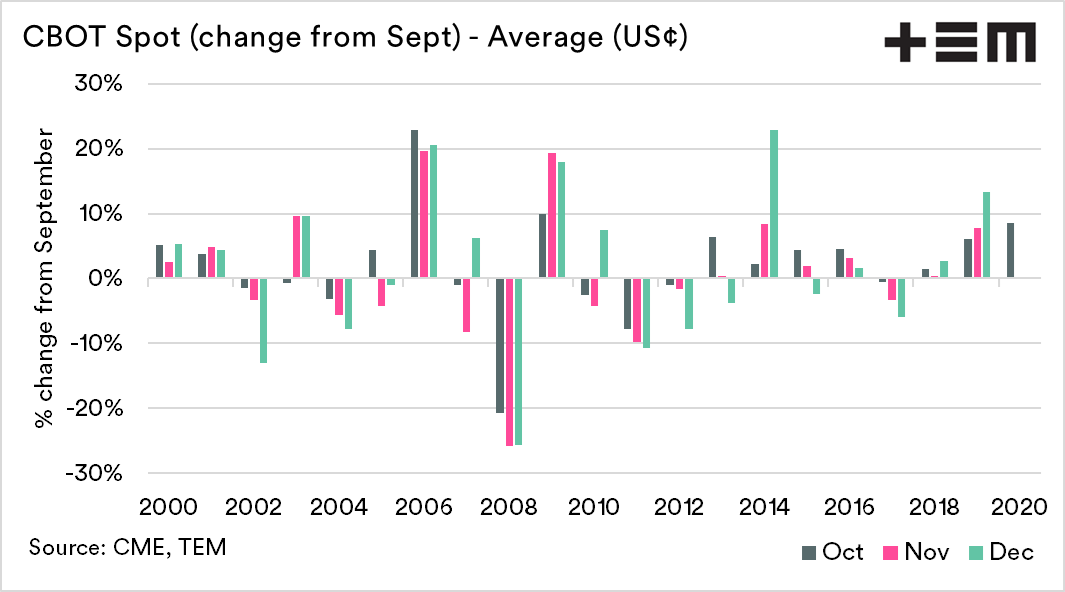
US dollar terms
Chicago wheat futures are traded in US$ terms. Therefore it is worthwhile firstly having a quick look at the change in local values.
This chart represents the average monthly price for spot futures during September versus the average spot price during the following three months. At present in US$ terms the CBOT spot futures are up 9% on the average level for October.
The average change is between 1-2% during the quarter compared to September. However, we can see that there has been a vast range. The worst years have seen declines of >20%, whilst the best years have experience >20% gains.
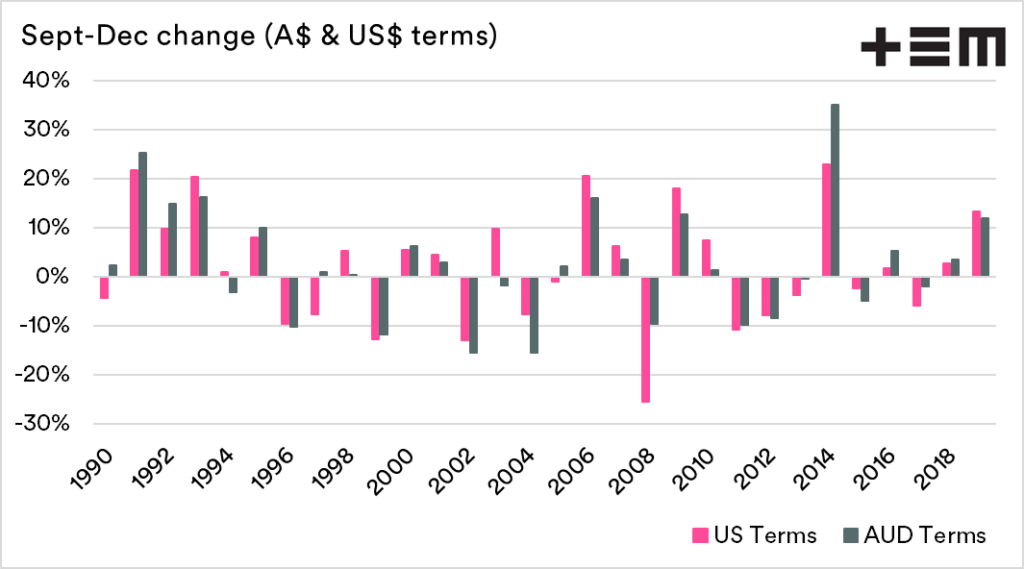
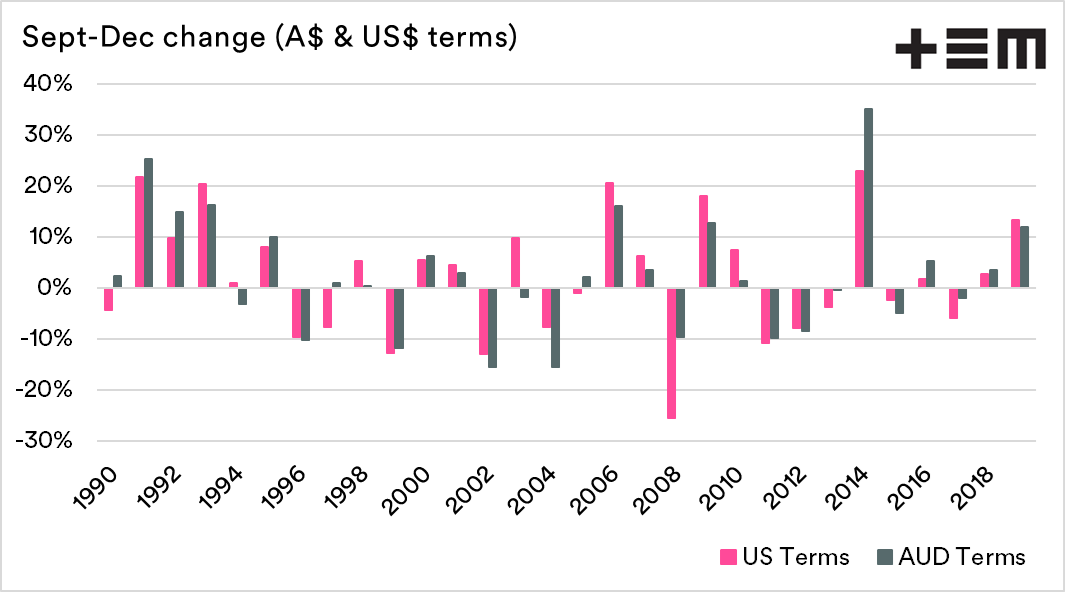
Australian dollar terms
It’s good to see the change in US dollar terms, as that gives an insight into the pricing for the underlying wheat price. In Australia, the futures price is generally converted in A$ terms, so we also need to examine with A$ taken into account.
On average, the change is very similar 2-3% increase from September. The difference is that the upward range seems larger. As an example, in 2014, the spot price in US$ terms was 23% higher than in December than September. In A$ terms for the same year, the rise was higher at 35%.
This goes to show the extremes caused by the additional element of the A$. In September of 2014, the dollar was at 90¢ against the greenback, by December it had fallen to 82¢.
Conversely, in 2008 the fall in A$ wheat swaps values was much lower than in US$ terms. This is due to a decline in the A$ from 82¢ to 67¢.

So, is it rare to have a rise in Q4?
Well, not really is the answer. The market can rally, but it can also fall. On average, the market is slightly skewed to a higher side.
One of the major drivers of risk (and reward) has been the A$ which has made a substantial difference.
It is important to note the old adage, that ‘past performance is not an indicator of future results’. Whilst we are only just over halfway through the month, the rise from September is one of the three largest increases during the past twenty years.
Without putting a dampener on things, the top two saw declines in November and December. Let’s hope the market doesn’t falter.