Decile Drop: Local wheat (May)
Decile Drop - May
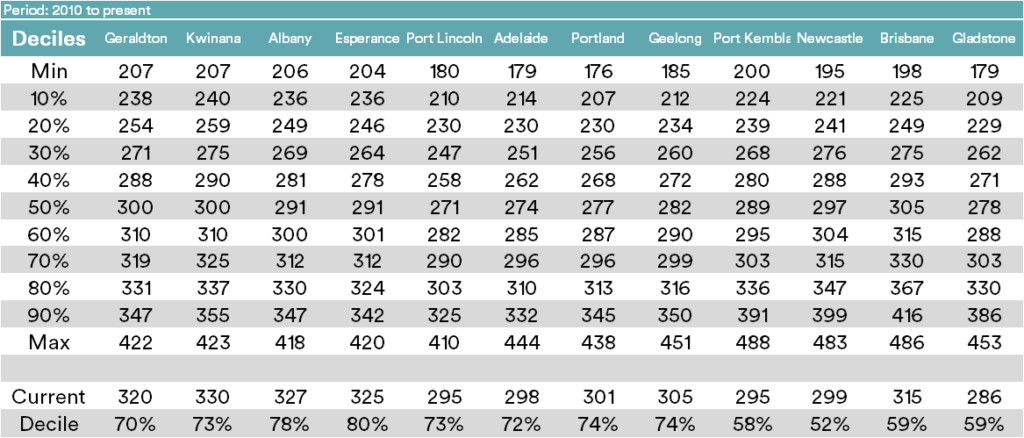
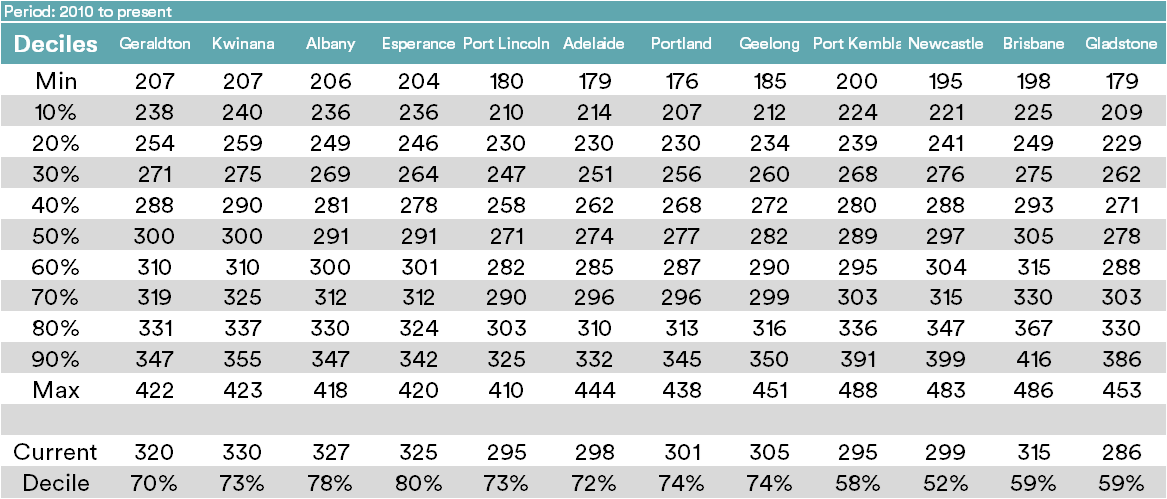
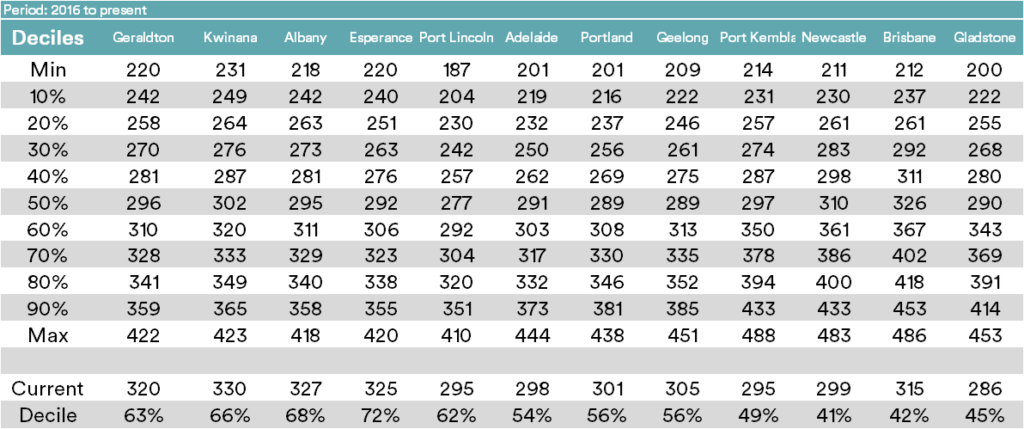
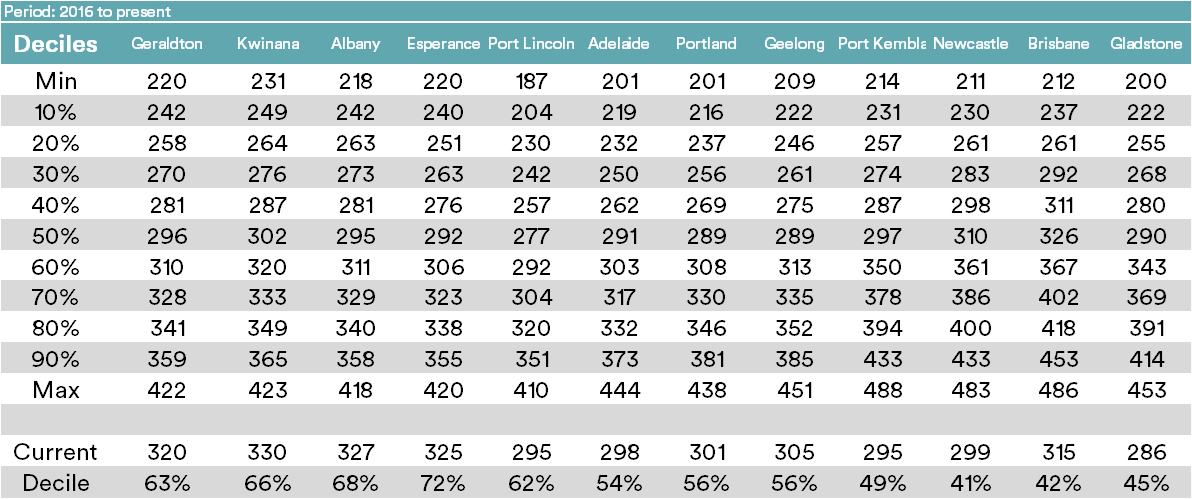
The tables below display the spot APW price for ports around Australia. Included are two timeframes of deciles, long term from 2010 & 2016 to present.
The tables display nominal prices relevant to each decile range, which can be used to get an understanding of how high (or low) the current price is in relation to historical pricing. A decile table measures how often, historically, prices have fallen above (or below) a particular pricing point.
It gives a brief snapshot of whether a market has more upside or downside and how large this may be.
For example, if a price is at its 40% decile, this means that 40% of the time, prices have been below that value and 60% of prices higher.
Similarly, a 90% decile means that 90% of the time, prices have been lower and higher just 10% of the time. Please note that a price can’t reside outside of the 100 percentile.
At the bottom of each table is the current price and the percentage decile ranking for that price.
Comment:
There is a wide range in deciles for current prices across the country, with the NSW/QLD being the worst compared to recent years. It is important to note that pricing levels were significantly higher than in other areas in the recent drought. That being said the nations grain pricing elsewhere is at 70-80th decile, whereas overseas futures are at the 100th decile.
To view wheat futures deciles click here.