Decile Drop: Wheat futures (May)

Decile Drop - May
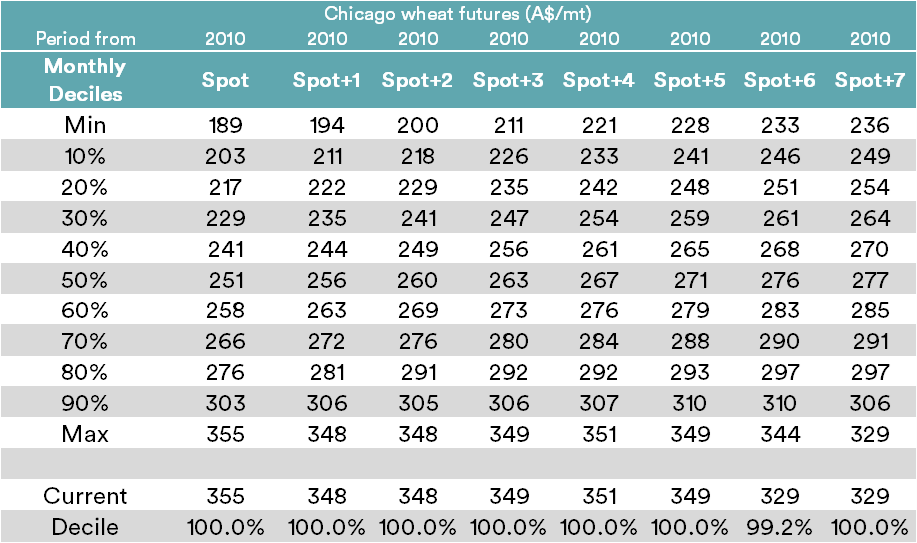
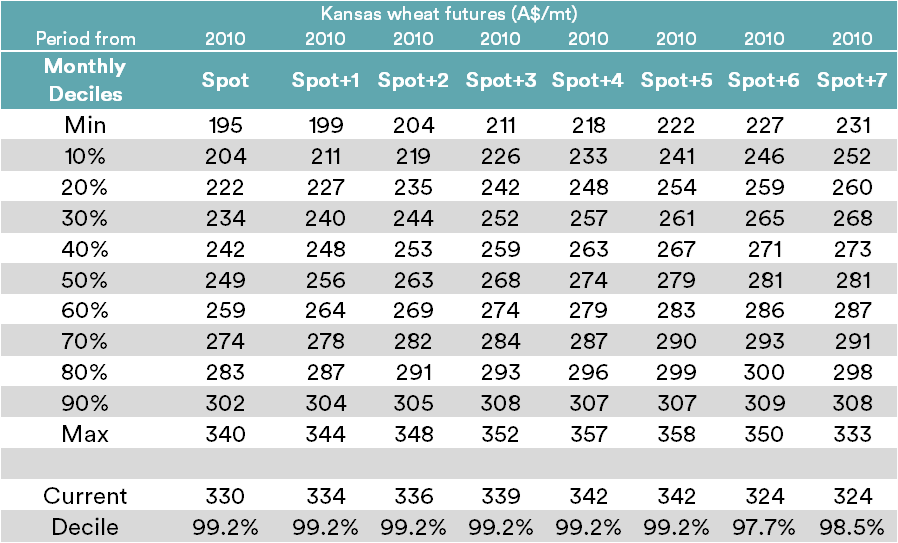
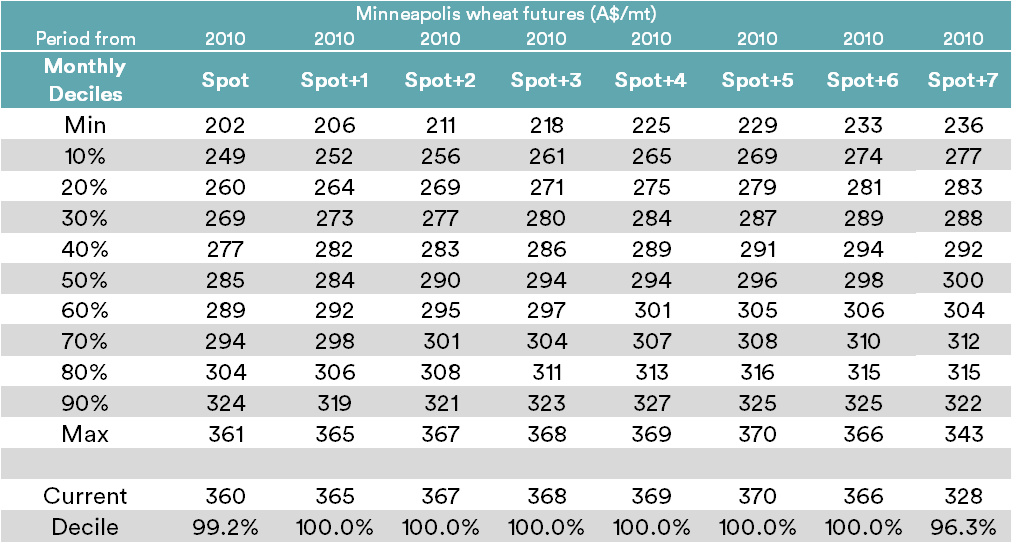
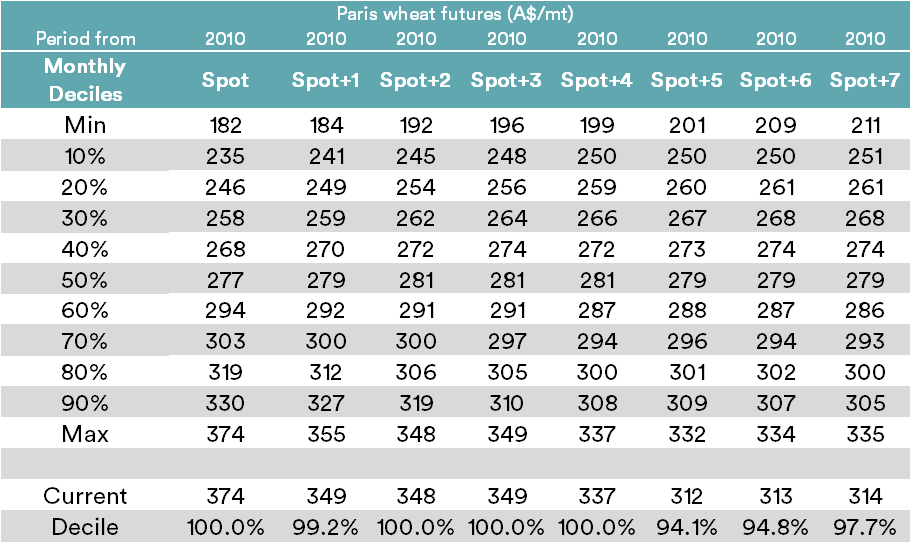
Decile tables for the monthly average price for various overseas futures values. These decile tables include the spot contract and the following 7 contracts. This gives an insight into the forward curve of the wheat markets.
Included tables:
- Chicago
- Kansas
- Minneapolis
- Paris
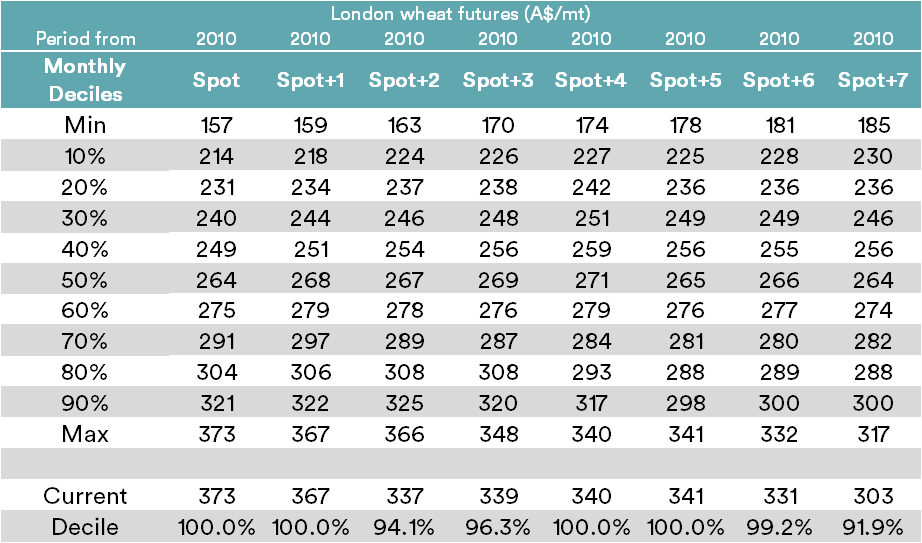
- London
The tables display nominal prices relevant to each decile range, which can be used to get an understanding of how high/low the current price is in relation to all historical prices. A decile table measures how often, historically, prices have fallen below (or below) a particular pricing point.
It gives a brief snapshot of whether a market has more upside or downside and how large this may be.
For example, if a price is at its 40% decile, this means that 40% of the time prices have been below that value and 60% of prices higher. Similarly, a 90% decile means that 90% of the time, prices have been lower and higher just 10% of the time.
Please note that a price can’t reside outside of the 100 percentile.
At the bottom of each table is the current months average price and the percentage decile ranking for that price.
To view the last update click here, to view Australian physical pricing click here
Comment:
The deciles across all overseas exchanges are at, or very close to the 100th (since 2010) percentile in A$ terms. This means that futures in our currency have never been higher since 2010.
Whilst it is possible that pricing will increase, it is a signal that it is worthwhile conducting some selling.