
Grain prices move significantly higher on overnight reports.

The Snapshot
- US wheat production is forecast to fall to its lowest level since 1972, triggering limit-up rallies in wheat futures markets.
- Global corn ending stocks are projected to fall to their lowest level since 2013/14, tightening the global feed grain balance sheet.
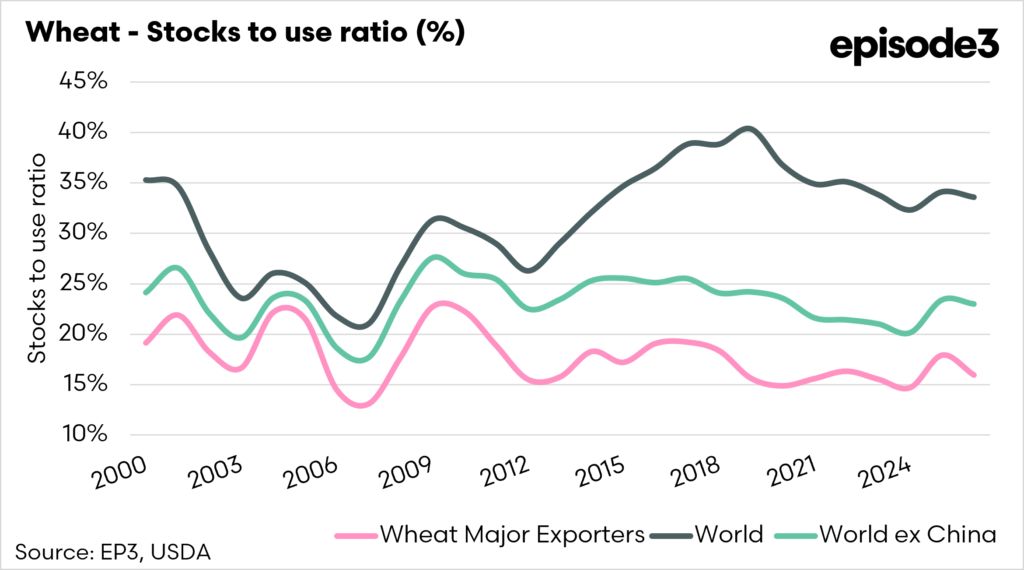
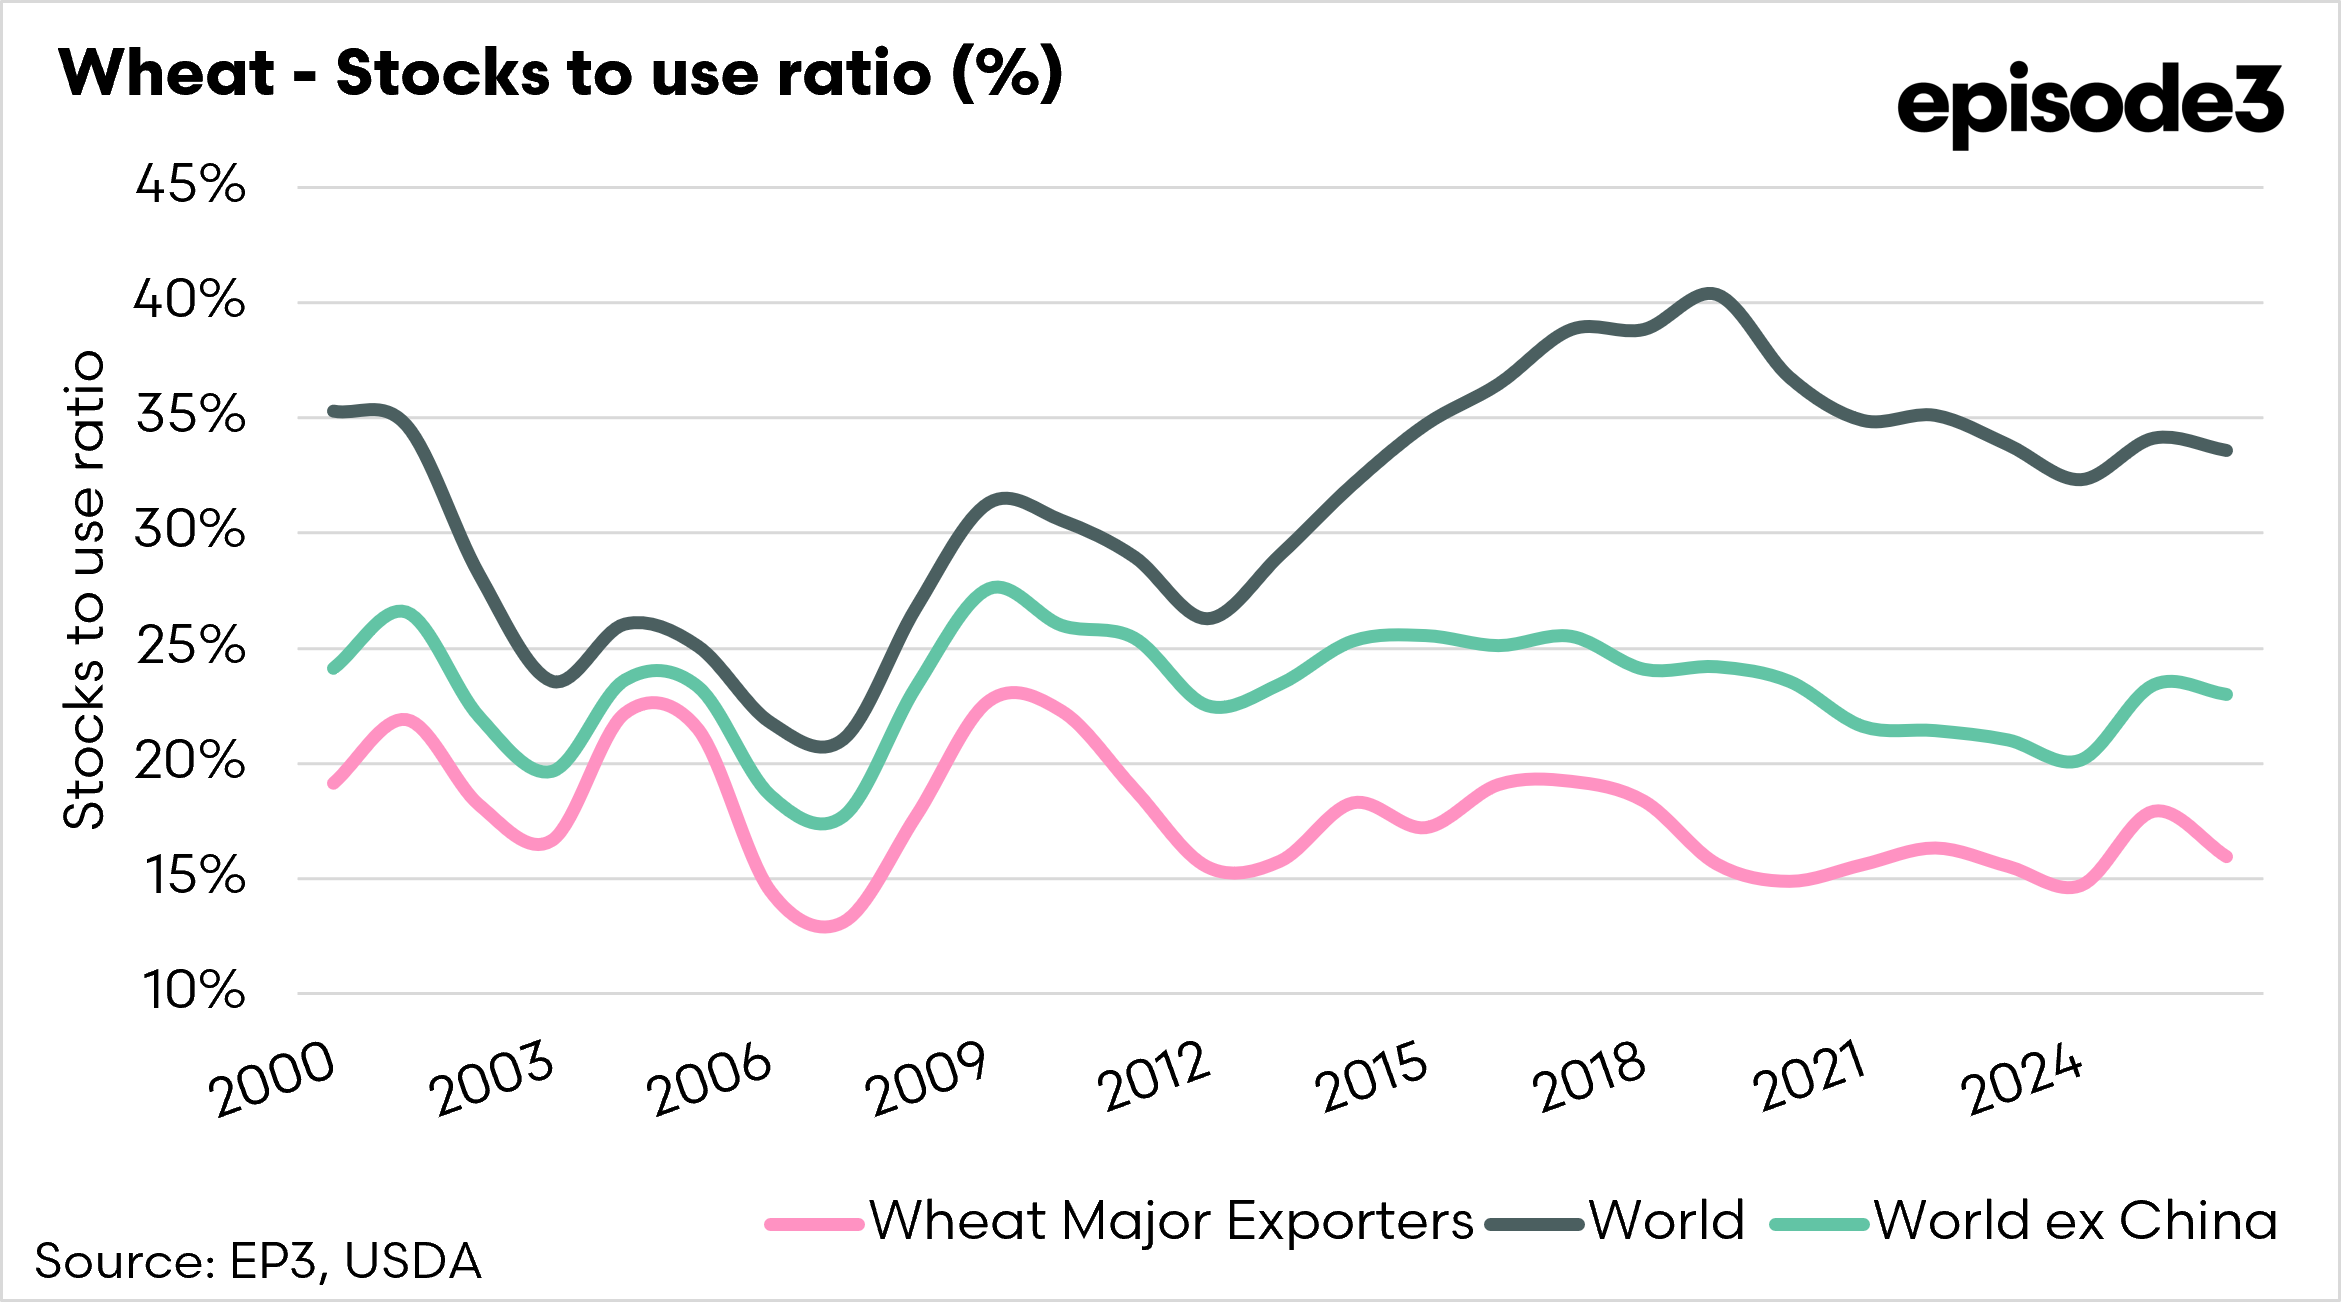
- Exporter wheat stocks remain far tighter than headline global stock figures suggest, particularly once China is excluded.
- Rising diesel and fertiliser costs linked to the Strait of Hormuz disruption are beginning to directly influence global crop production decisions.
- Tightening global grain supplies and shrinking exporter buffers could create stronger pricing opportunities for Australian grain growers in 2026/27
The Detail
Australia’s attention today will be focused on the Federal Budget, but grain growers may ultimately find that a report released half a world away has just as much bearing on their profitability over the next 12 months.
Geopolitics might dominate headlines, but supply and demand still ultimately determine grain prices.
Wars, tariffs, sanctions and shipping disruptions matter because they influence production, trade flows, fertiliser costs, fuel prices and ultimately how much grain the world produces and consumes. Over time, however, markets still tend to revolve around the core fundamentals of available supply compared to demand.
That is why the monthly USDA World Agricultural Supply and Demand Estimates (WASDE) report remains one of the most closely watched events in global agricultural markets.
The first WASDE report for the 2026/27 marketing year delivered a much tighter and more weather-sensitive outlook for global grain markets than many traders had anticipated, particularly for wheat and corn.
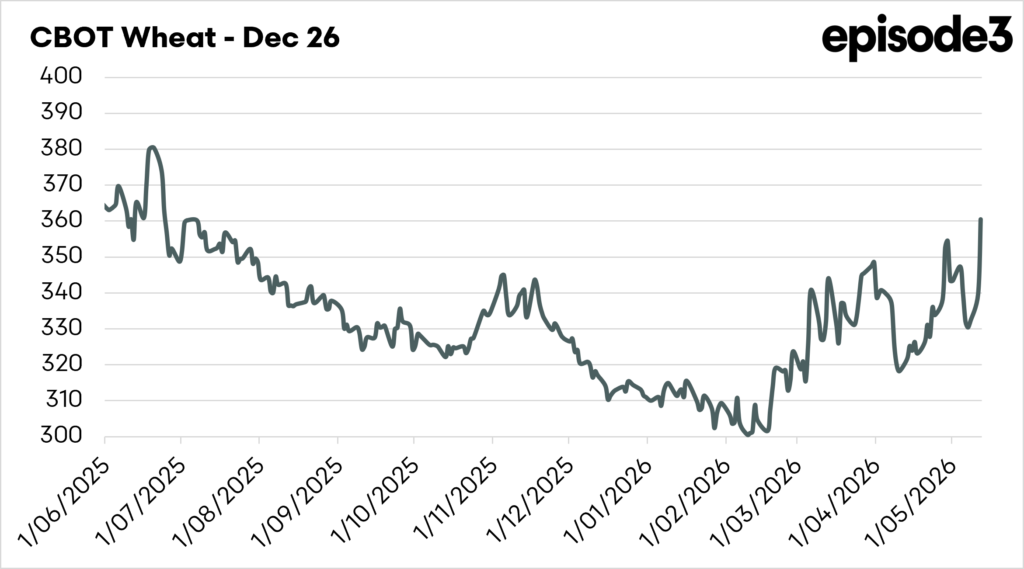
Chicago and Kansas wheat futures both surged by their daily trading limits after the USDA projected the smallest US wheat crop since 1972. Hard red winter (HRW) wheat production, grown predominantly across the drought-stricken southern Plains and used heavily in breadmaking, is forecast to fall to its lowest level since 1957.
The scale of the downgrade caught the market offside.
USDA pegged total US wheat production at 42.5 million tonnes, well below trade expectations near 47.2Mt. At the same time, just 28pc of the US winter wheat crop was rated good-to-excellent, the weakest rating for this stage of the season in four years.
Kansas City July wheat futures, which reflect the HRW market, closed limit-up at contract highs, while Chicago wheat futures also rallied to their highest levels since October last year.
The wheat story dominated the headlines, but the broader message from this WASDE runs deeper than a single drought-hit crop. The report suggests global grain markets are moving away from the comfortable surplus environment that has defined much of the past decade and into a period where the margin for error is becoming increasingly thin.
At first glance, the global wheat balance sheet still appears reasonably comfortable.
The USDA forecast world wheat ending stocks at 275 million tonnes for 2026/27, only modestly below last year. On paper, that does not immediately scream shortage.
But two charts accompanying this analysis help explain why the wheat market reacted so aggressively despite headline global stocks remaining historically large.
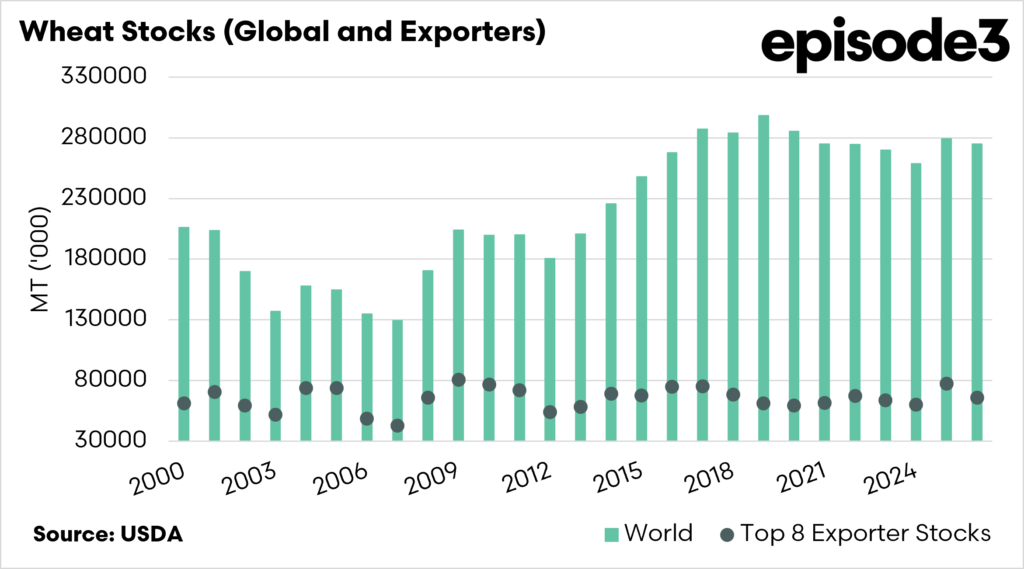
The first chart shows that while total world wheat stocks have climbed substantially over the past two decades, stocks held by the major exporting nations have remained comparatively flat. In practical terms, much of the increase in global inventories has occurred in countries such as China and India rather than among nations supplying the export market.
Markets do not price theoretical wheat sitting in storage. They price accessible exportable supply. That distinction matters because it helps explain why wheat futures can rally aggressively even when analysts point to historically large global stocks. The key point is what is happening with the top 8 exporters.
The second chart highlights the issue even more clearly. While total world wheat stocks-to-use ratios stay in the low-to-mid 30pc range, the ratio drops sharply once China is excluded. More importantly, exporters’ stocks-to-use ratios remain comparatively tight, generally sitting in the mid-to-high teens.
That means the wheat actually available to global importers is far tighter than headline world figures imply. The market is increasingly vulnerable to production shocks among the major exporters.
USDA lowered production expectations not only for the US, but also for several other key exporting regions, including Australia, Argentina and the European Union.
For Australian growers, that matters because Australia punches above its weight in global wheat trade. While countries such as China and India may hold enormous wheat inventories, Australia remains one of the world’s key suppliers of freely traded wheat exports to Asia and the Middle East.
When exporter stocks tighten globally, Australian seasonal conditions suddenly become far more influential on international pricing.
Although wheat stole the attention, the global corn balance sheet arguably carries even larger implications for the broader agricultural economy.
USDA forecast world corn ending stocks at 277.5Mt, the lowest level since 2013/14. While still not critically tight by historical standards, the reduction leaves considerably less room for weather problems heading into the Northern Hemisphere growing season.
Importantly, USDA’s production forecasts still rely heavily on trend yield assumptions and relatively normal summer weather.
US corn production is forecast to decline 6pc from last year’s record crop to 406.3Mt, largely due to lower planted area. Yet despite the reduction, the projected US yield remains historically strong.
The current balance sheet assumes things largely go right from here. That creates a market environment in which weather forecasts suddenly matter far more than they did just a year or two ago.
Corn is particularly important because it anchors much of the global feed grain complex. It influences livestock feeding margins, ethanol production, feed costs and broader grain pricing relationships worldwide. When global corn stocks tighten, it tends to underpin feed grain values more broadly, including barley and feed wheat markets in Australia.
Higher fertiliser prices appear to have influenced crop mix decisions in the United States, with growers favouring soybeans over more fertiliser-intensive crops like corn. There are also growing concerns that elevated nutrient costs may reduce fertiliser application rates, potentially impacting yields.
Rising diesel prices, elevated fertiliser costs and increased shipping volatility are already feeding into local input budgets. While stronger global grain prices may support Australian prices, the risk is that rising costs will continue to eat into margins.
That is likely to remain one of the defining themes of the 2026/27 marketing year.
Global wheat stocks are still historically reasonable and Northern Hemisphere crops still have much of the growing season ahead of them.
For Australian grain producers, the key takeaway is not necessarily that prices must move sharply higher from here. Rather, markets are becoming increasingly sensitive to weather and geopolitical disruptions at a time when global exporter buffers are no longer particularly large.
That likely means volatility and pricing opportunities will remain elevated over the year ahead.
And while Canberra debates inflation, taxation and spending priorities this week, Australian grain growers may ultimately find that the combination of US drought, tightening exporter stocks, and rising geopolitical risk has a far greater influence on their bottom line than anything delivered in the Federal Budget.