Market Morsel: Around the world, around the world

Market Morsel
At EP3, we regularly examine the stocks to use ratio.
The stocks to use (STU) ratio is a crucial barometer that is used to provide an insight into the relationship between supply and demand. You can read more about it here (see here)
The higher the ratio, the better supplied the world is (and vice versa).
We thought it would be worthwhile to have a look at the STU on a region by region basis. In the chart below, the STU is displayed for the following regions:
- EU
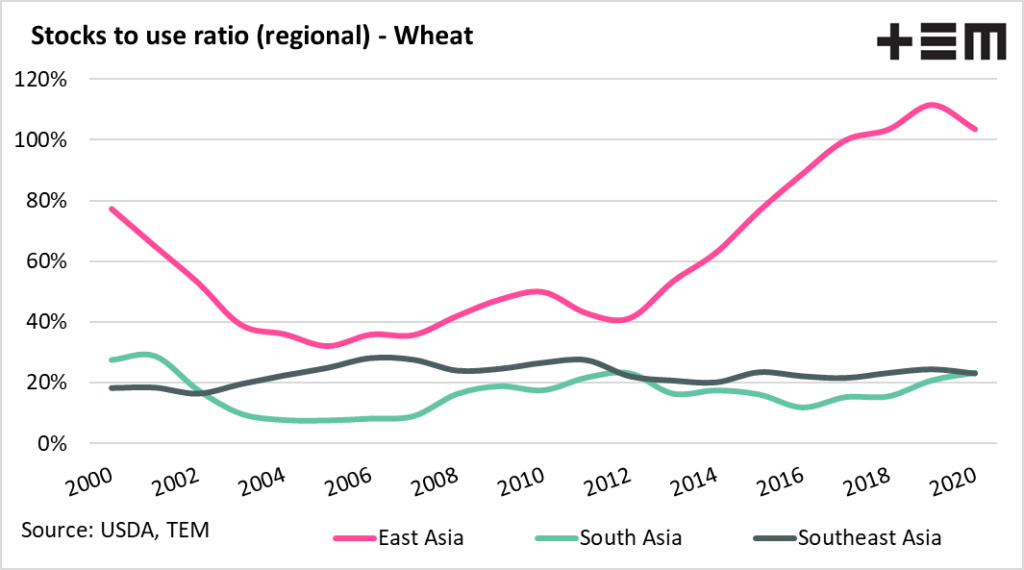
- East Asia
- South Asia
- South-East Asia
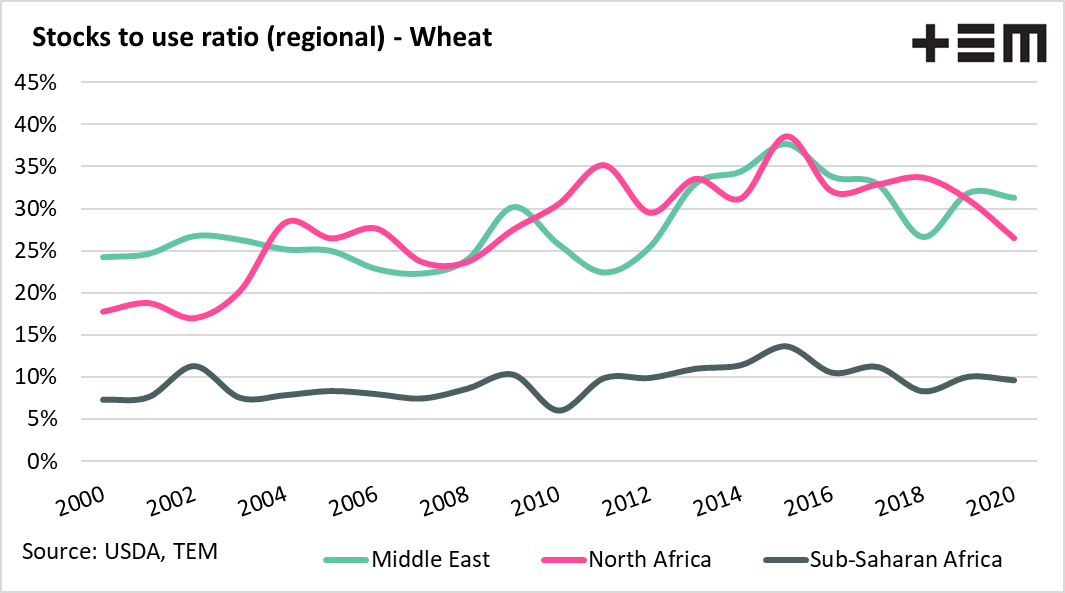
- Middle east
- North Africa
- Sub-Saharan Africa
A few major points to consider:
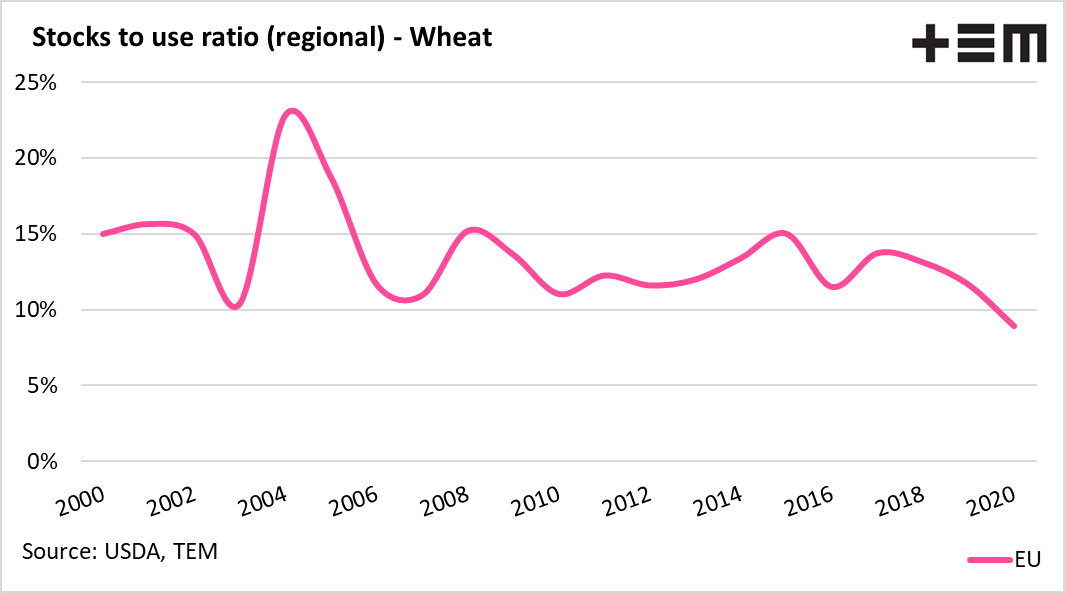
The EU stock to use ratio has fallen to <9%, which is at extremely low levels. The lowest level for forty years. A lower STU points towards a reduced ability to provide a strong export program.
The East Asian STU has risen rapidly since the start of the last decade, off the back of China’s stocks. Whether they exist in physical form or just on paper is another question.
The North African STU has been declining in recent years. A large supplier of North African wheat is Europe.