It’s not just size; it’s also how you use it.
The Snapshot
- The stock to use (STU) ratio is an excellent barometer of both supply and demand.
- When the ratio is high, then prices tend to the downside, as stocks are ample.
- When the ratio is low, then prices are liable to increase, as the supply/demand balance becomes fragile.
- The global wheat stocks to use is very healthy (41.5%) pointing towards lower pricing levels.
- The good thing is that wheat does not operate in a bubble, and the corn balance helps. The global corn STU is 24.7%, the lowest since 2013/14.
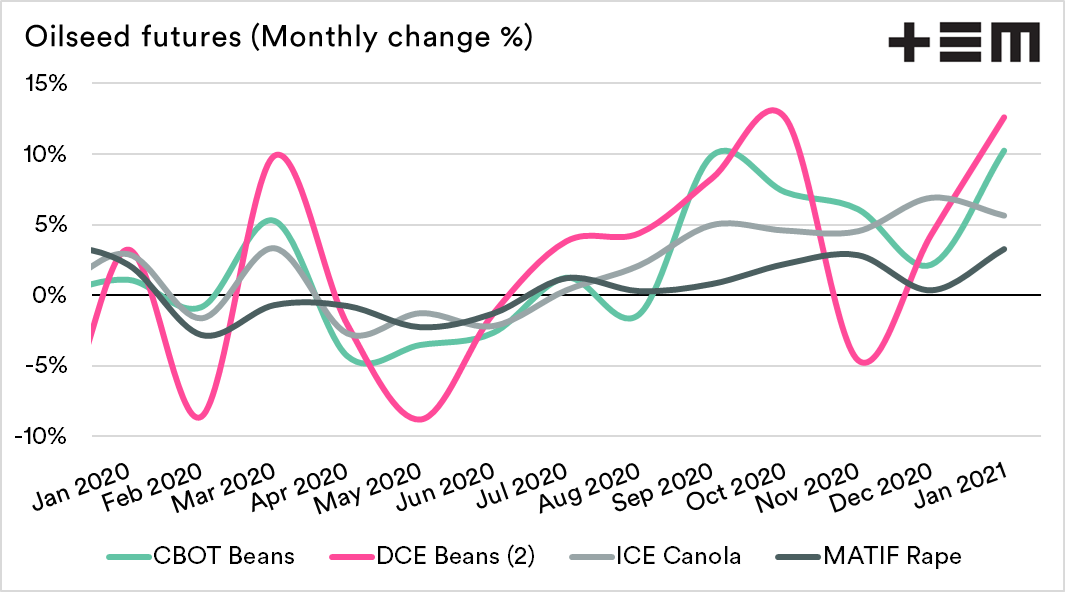
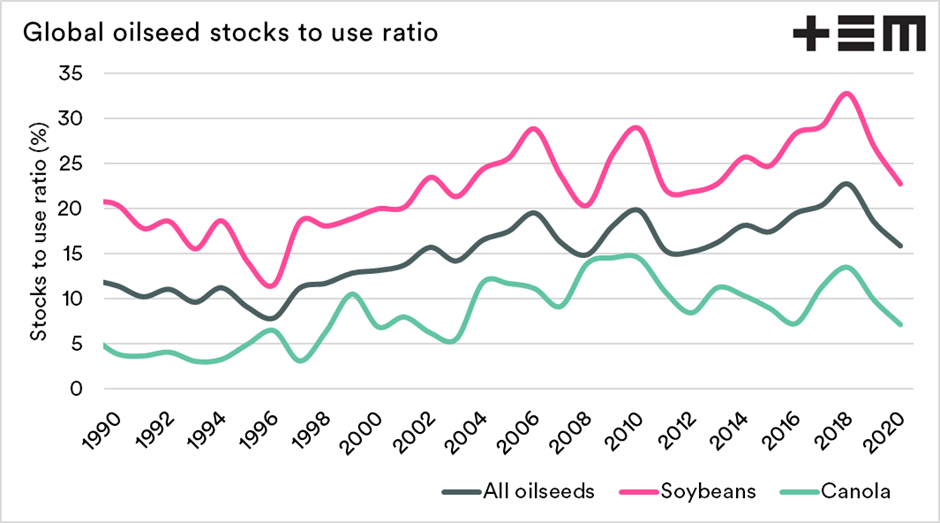
- The global oilseed STU is at 22%, which is the lowest since 2013. The global canola STU is at 7%, the lowest since 2016.
- A falling STU for oilseeds overall & canola has seen prices rise rapidly in the second half of 2020.
- It’s all a case of supply and demand driving pricing!.
The Details
Yesterday, I looked into the WASDE numbers (see here), which cause an increase in Chicago futures pricing. After receiving many queries, I thought it was worth looking further into the detail as we start the year and do a refresher on the stocks to use.
The stocks to use (STU) ratio is a crucial barometer which is used to provide an insight into the relationship between supply and demand.
The STU ratio can is displayed as either a % or a number of days. I prefer using a ratio, but both are showing the same thing.
The higher the ratio, the better supplied the world is. As an example, in the chart below, wheat is at 41.5%. This means that the world has enough wheat in stores to meet 41.5% of a year’s demand in theory.

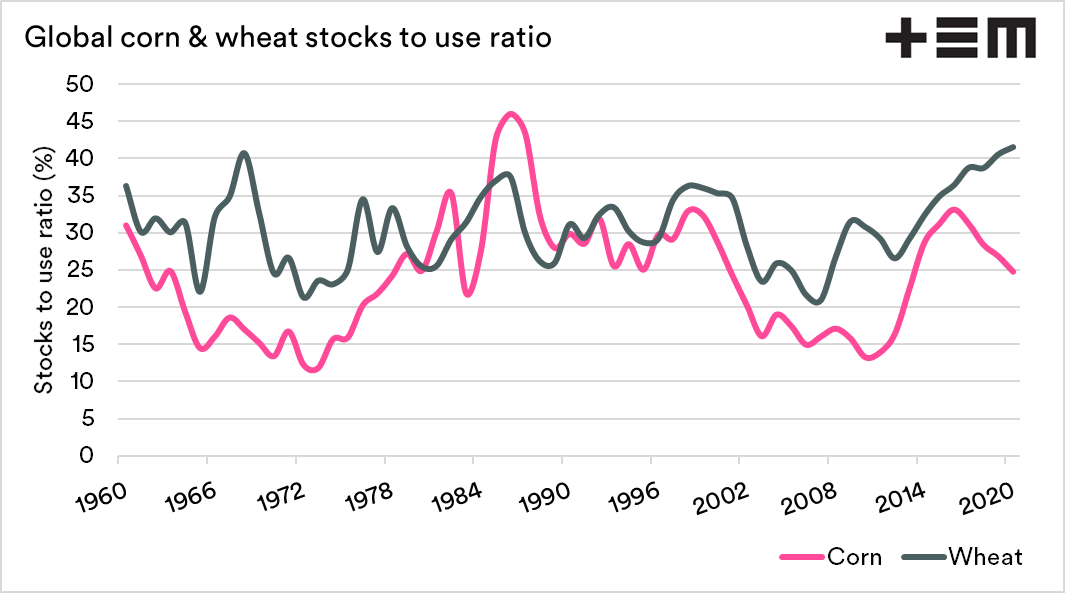
I have displayed the STU for wheat and corn together, as they tend to have close relationships. In recent years we have seen the STU of wheat increase dramatically, due to years of record production causing large stockpiles. It is important to note China’s (see here) wheat position, as this has a significant impact on the overall picture.
The reality is that wheat has a very comfortable STU, even bearish when viewed globally. The corn picture, however, has seen a downward trend in comfort.
At present, the corn STU is at 24.8%. Biotechnology has seen healthy improvements in yields; the usage has also considerably increased from energy to industrial purposes. The fall in production has resulted in the supply/demand picture is markedly tighter.
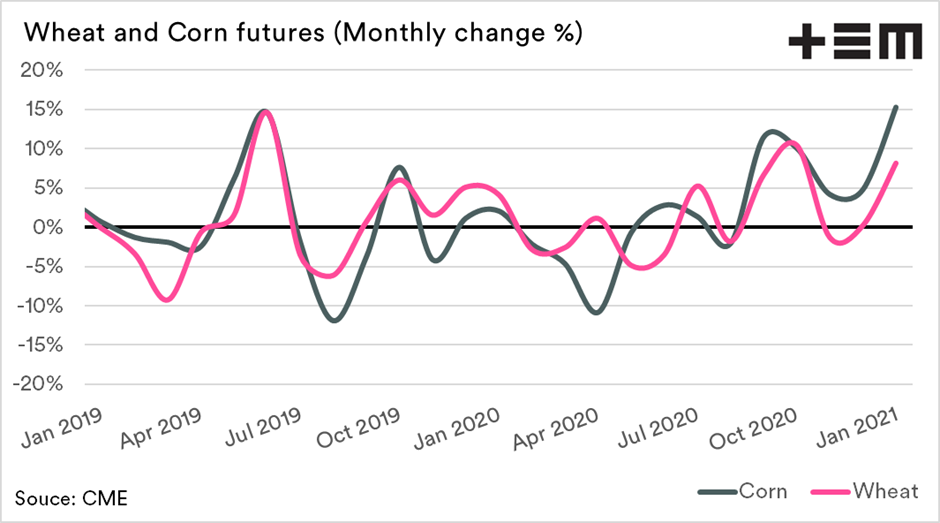
It might sound like groundhog day for our regular readers, but I have to reiterate the close link between corn and wheat. They tend to move in lockstep with one another. At present, this is good, because the corn market is lifting us up. If our wheat market traded in a bubble, we would see much lower prices.
As corn prices rise, we may start to see some demand destruction. However, fundamentally prices are currently set at reasonable levels for the coming months.
The oilseed sector
The stocks to use ratio reached a very healthy level in 2018 for combined oilseeds, soybeans and canola. In fact the peaks for the decade. Since then the STU has declined and is now at levels which are very supportive for higher pricing levels.
I’ve picked a selection of oilseed futures prices from our database. During the last half of 2020, most of the time we have experienced oilseeds ending averaging up each month.
The reality is that La Nina can impact oilseed production in South America, which could mean that STU could stay lower for longer. This would prompt higher oilseed prices for some time.