Market Morsel: Canada’s loss, Aus gain.

Market Morsel
Statistics Canada are set to release their latest update for their crop next week. We have spent a lot of time looking at Canada in recent months, as it has a big impact on our pricing levels. This is especially important for our canola (and pulses).
Refinitiv recently conducted a poll of trade expectations, and they are in a wide range. Ahead of the release of the official data, I thought it was worthwhile charting out what the thoughts are.
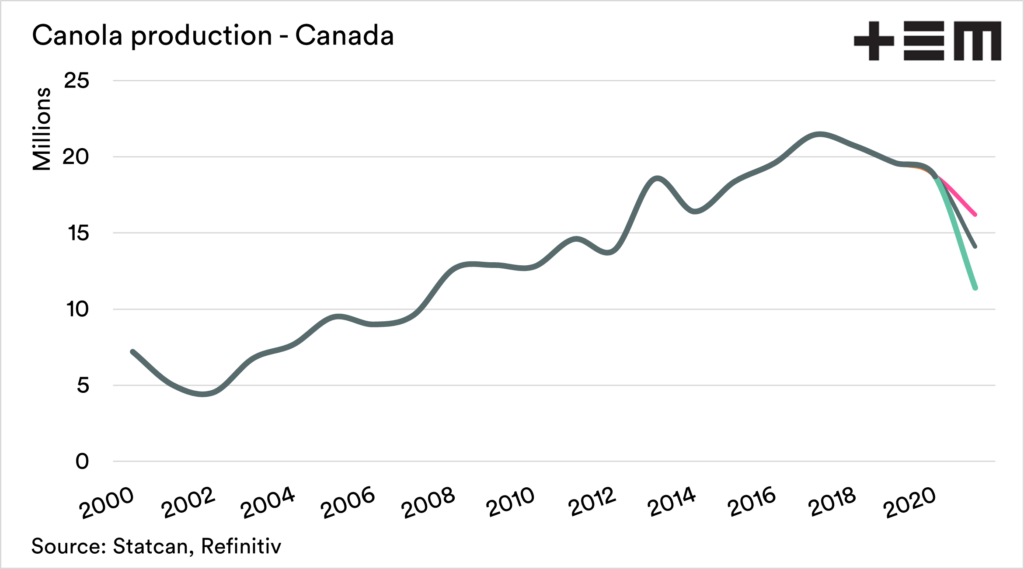
Canola – average 14.1mmt, low 11.4mmt & high 16.2mmt.
The average production of canola since 2010 has been 17.7mmt. Production has not been at sub 14m since 2012. Domestic consumption of canola in the past two years has been between 10.5 to 11mmt. If the lower end of the range eventuates, there will be little leftover for exports.
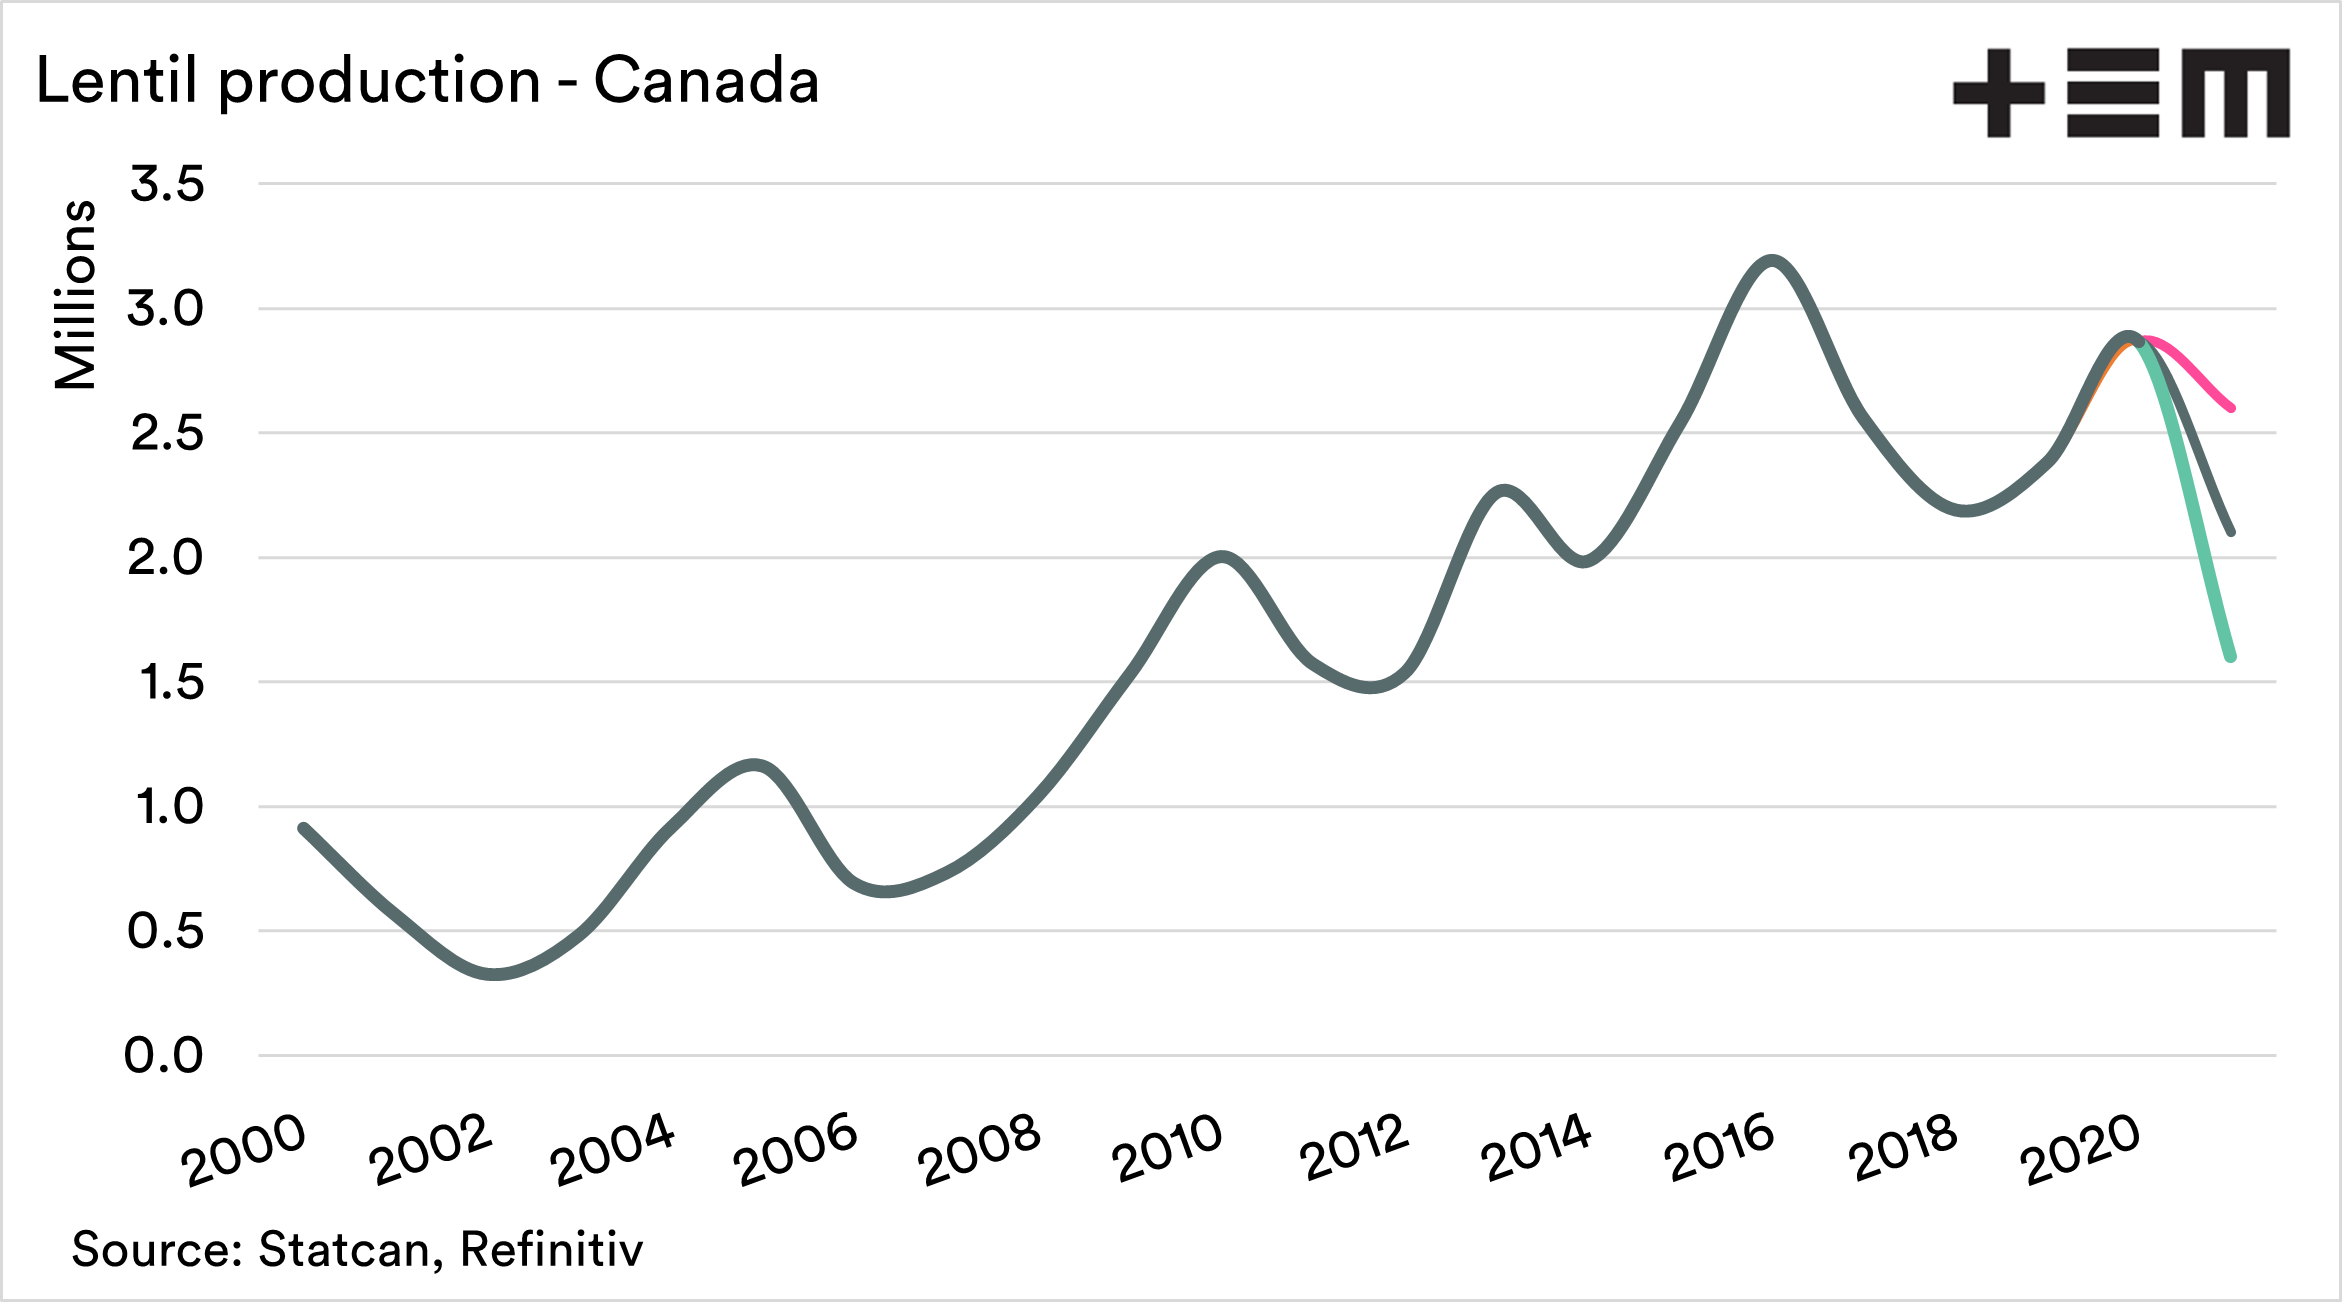
Lentils – average 2.1mmt, low 1.6mmt & high 2.6mmt.
The average expectation of 2.1mmt is approximately 400kmt lower than the recent year average but nearly 800kmt lower than last year.
To put it into perspective, Australian expectations are between 600 and 700kmt this year. This will provide an opportunity to fill the gap whilst India has reduced import barriers.
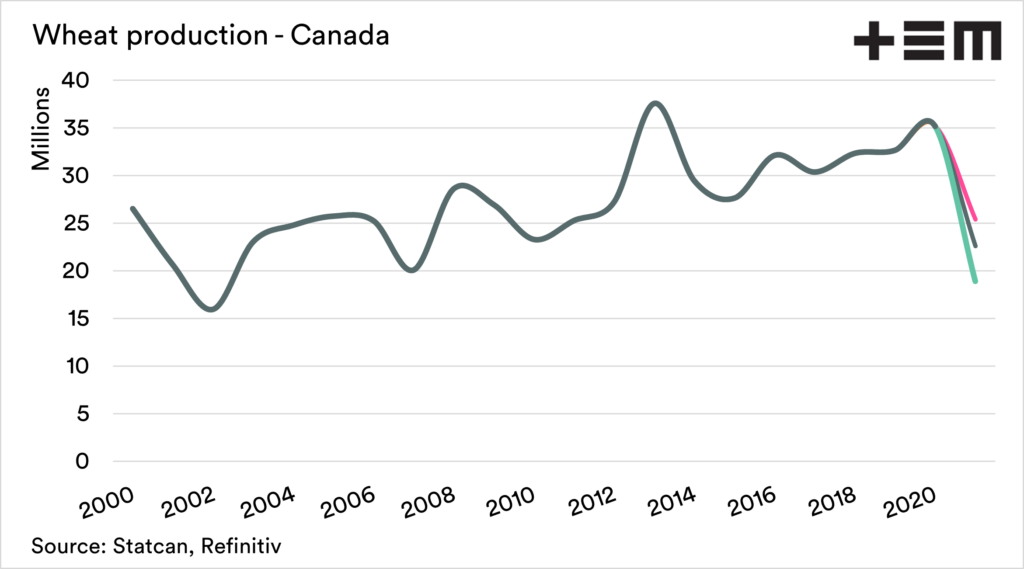
Wheat – average 22.6mmt, low 18.9mmt & high 25.4mmt.
The trade are very pessimistic on the wheat forecast. The average production in Canada since 2010 has been 30.2mmt. A 22.6mmt crop is the lowest since 2007.
Canada is one of the worlds largest wheat exporters.
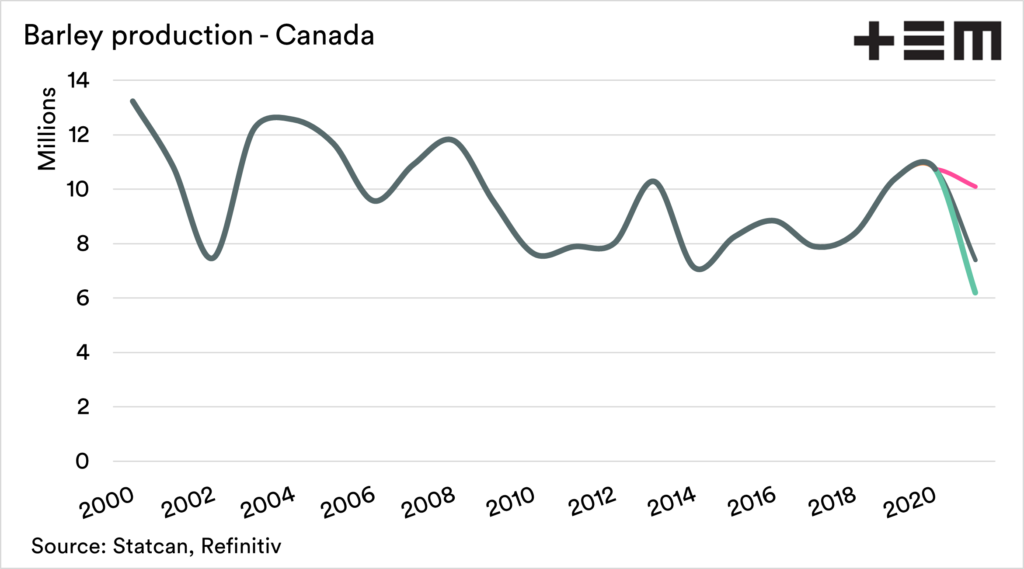
Barley – average 7.4mmt, low 6.2mmt & high 10.1mmt.
On average, Canada has produced 8.7mmt since 2010. The top end of expectations would be highly unlikely and would place production at one of the highest years in the past decade. The average would place this year at the lowest since 2014. This might even be a stretch.
Canada has traded barley into China, a lower exportable surplus will put pressure on Chinese importers. They may look to the bountiful crops in Australia and wish they could buy from us – but be forced to other nations at higher pricing levels (see here)
Summary:
It’s not a huge surprise to see the trade expecting lower production levels. StatsCan, like many government forecasters, may be reticent to make a drastic cut, but the truth will be out when the harvesters are rolling.
The reality is that, as we have been commenting for months, that Canada is stuffed. The big question is whether the data is already priced in. If it’s not priced in, then we could get further fireworks.
The charts below show Canadian production for each commodity since 2000, along with the 2021 high, low and average trade expectations.