Market Morsel: Forward to next season

Market Morsel
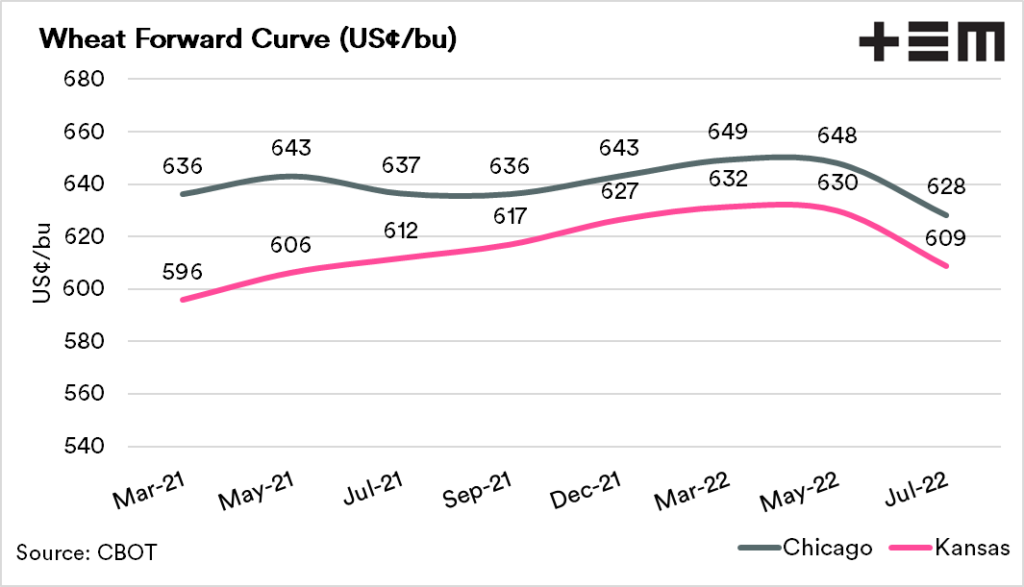
A tool worth using is the forward curve. The forward curve is a chart that we will often refer to in EP3 articles, as it provides a quick view of the market. The forward curve details the price for each of the contract expiry date for the futures contract of a commodity.
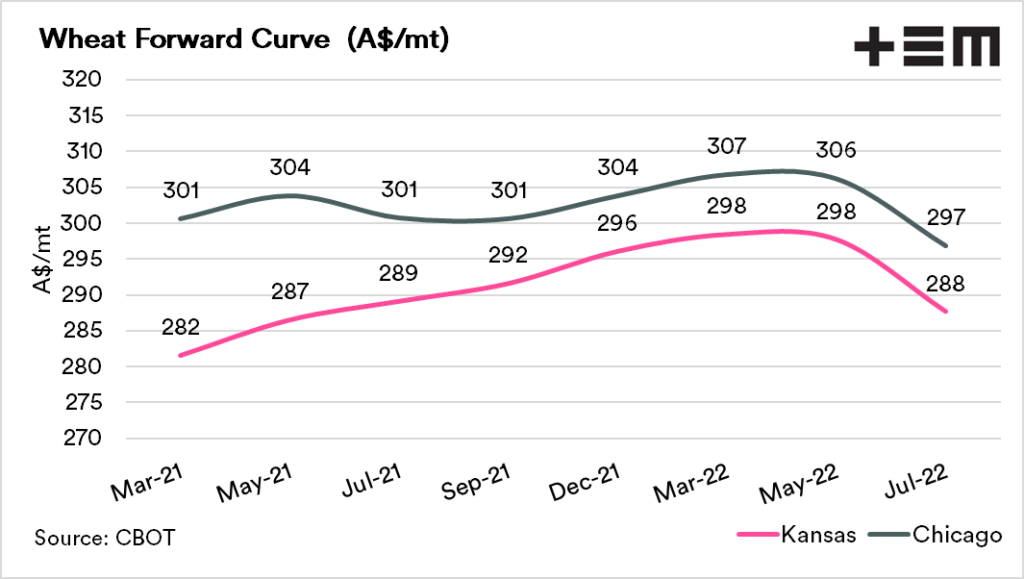
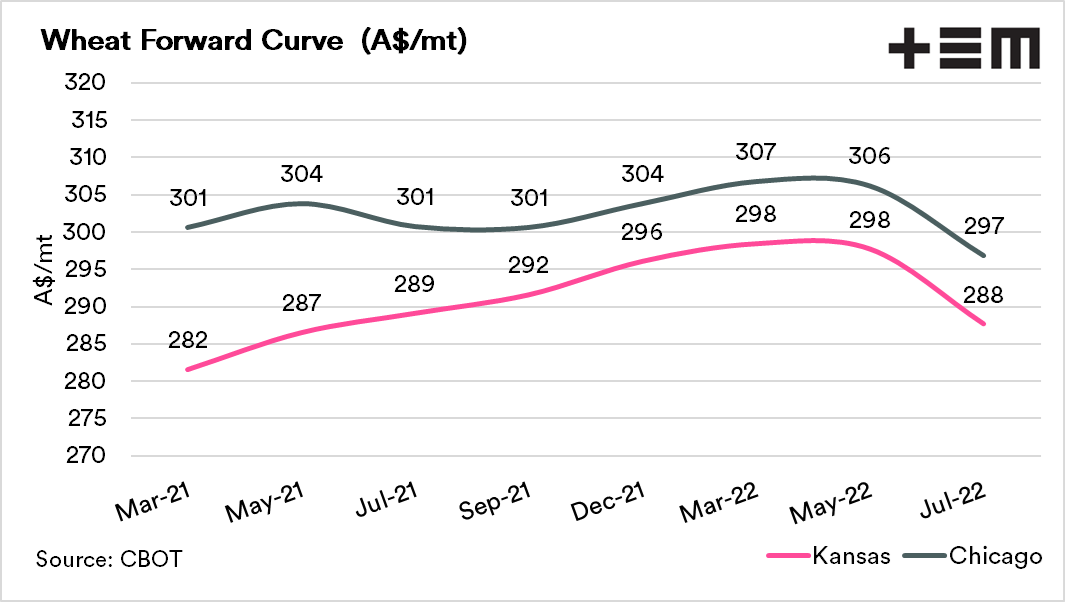
The curve gives an instant snapshot of where you could theoretically buy or sell the commodity. The below chart displays the forward curve for Kansas & Chicago wheat converted to A$/mt. This lets us know the price for each contract data between the spot (Mar 2021) contract and July 2022.
The futures price determines the majority of our pricing of wheat, and reaching out to the forward months can provide us with opportunities, as generally, the market is in contango (or carry). This is where forward prices offer a premium to the spot market.
At the moment, the market is quite flat compared to history (see ‘It’s a rare sight to see a wheat market like this’).
At present, locking in Chicago futures would give you a futures value of A$304, which would have basis added (or subtracted) when converting to physical. This compares to ASX, which has January 2022 at A$307 as the last settlement.