Market Morsel: Fundamentals fun for farmers.

Market Morsel
The wheat market has been strong. In recent weeks, wheat futures have hit the highest level since 2008 (in A$ terms). This is fantastic news, as it provides us with attractive pricing and good opportunities to use the futures market to lock in forward pricing.
I thought it was time to look at some of the fundamentals. The most valuable tool for keeping track of global supply and demand is the stocks to use ratio. The stocks to use ratio provides an overview of both supply and demand. A higher stock to use ratio is bearish (negative), and a lower ratio is bullish (positive)
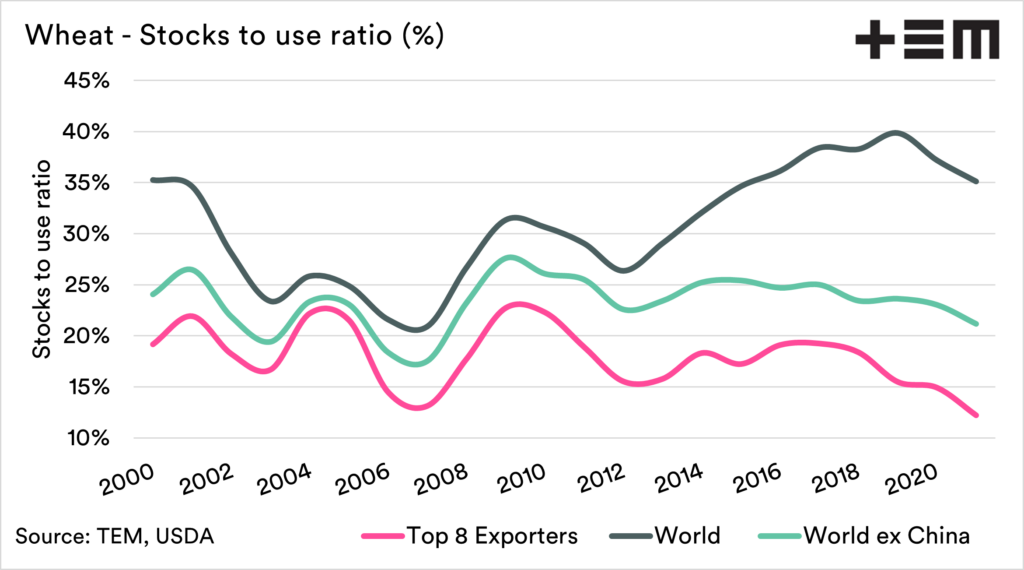
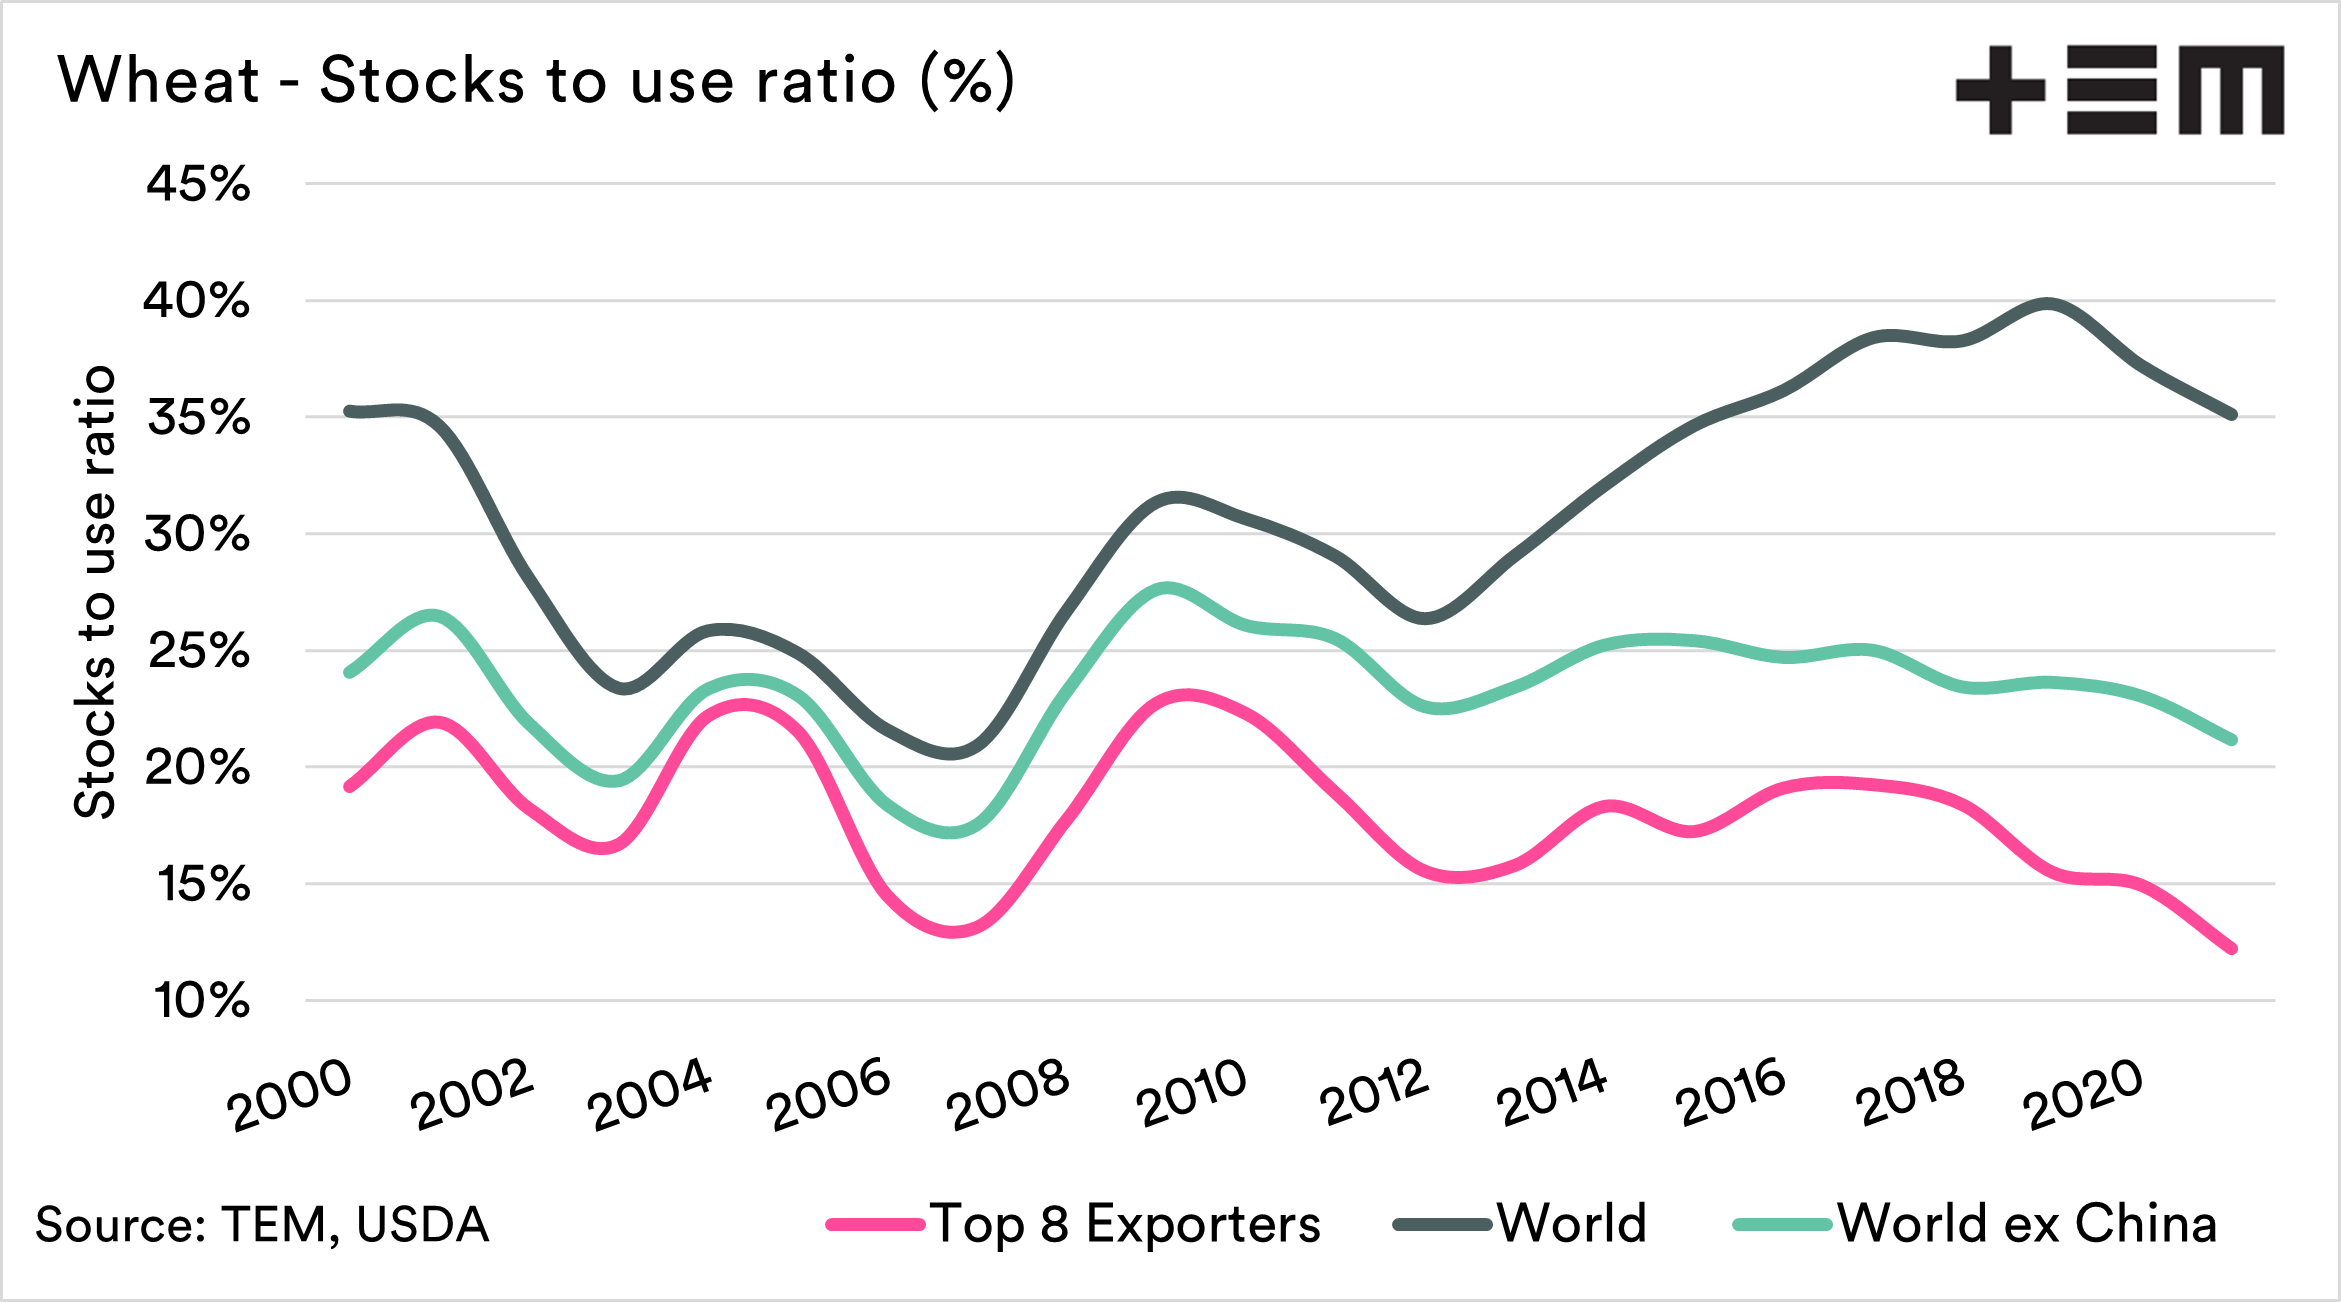
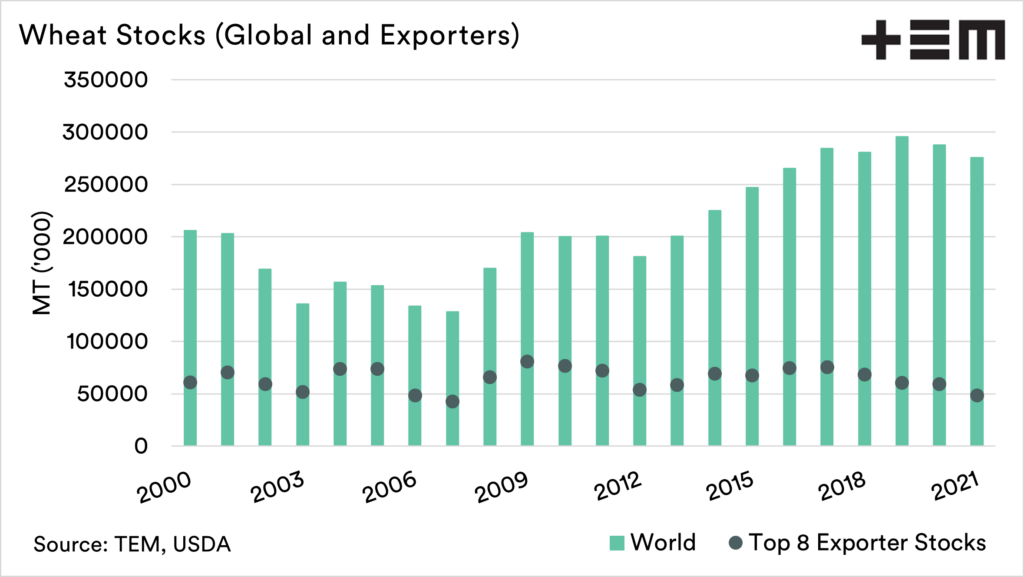
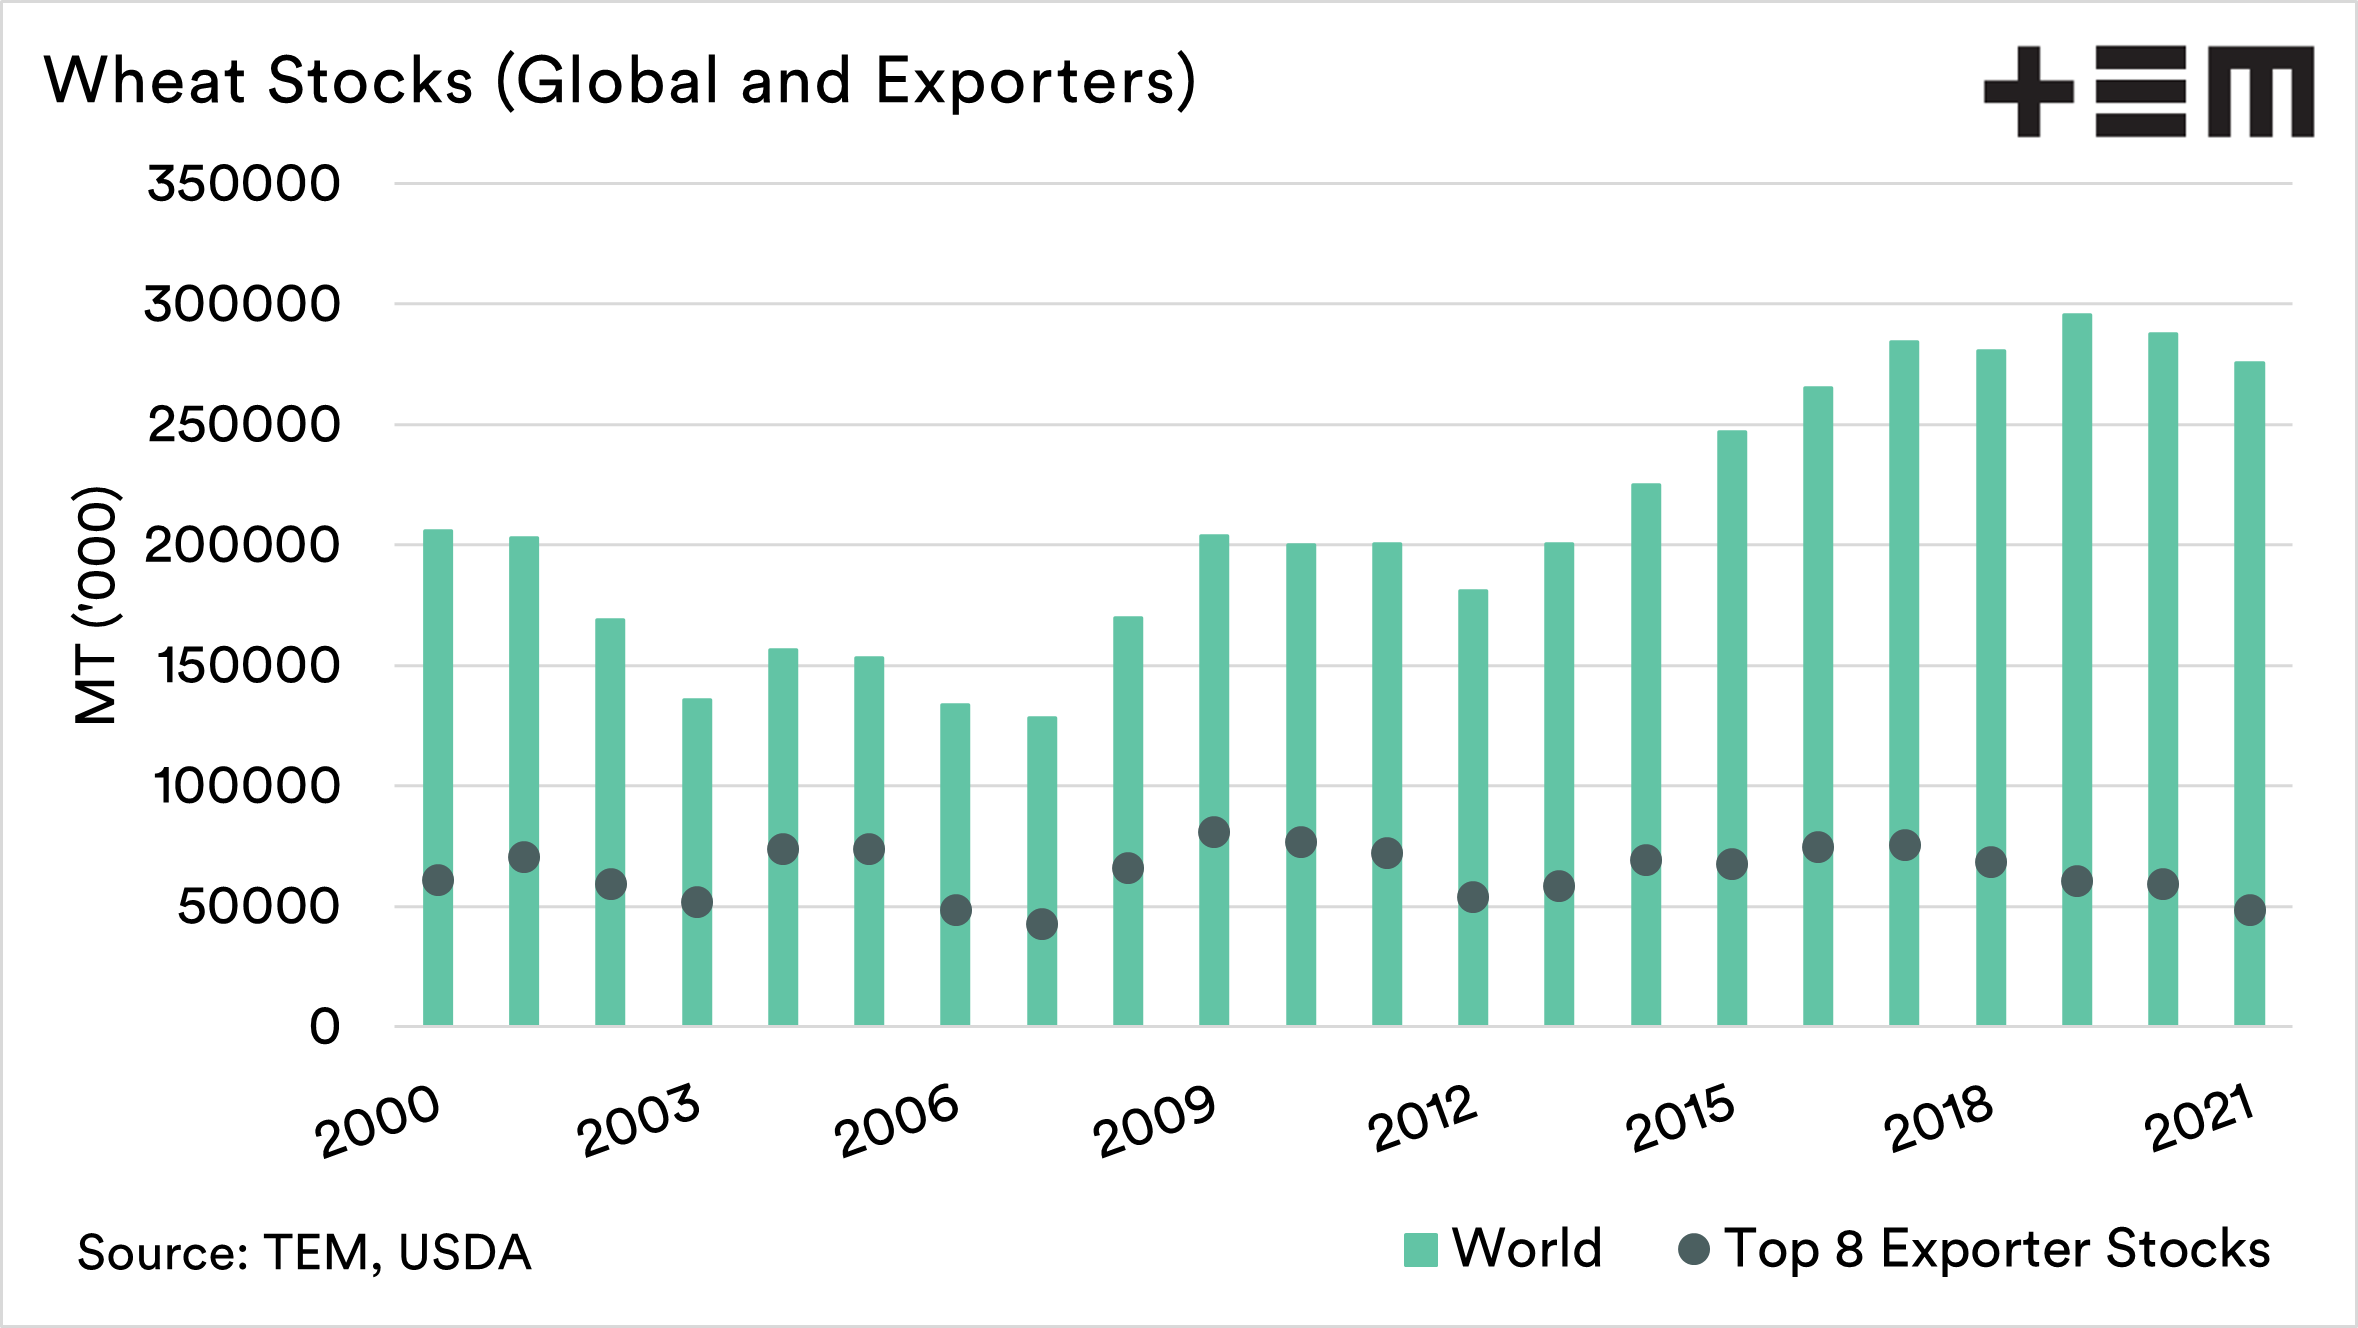
The first chart below shows the stocks to use ratio of wheat. I have separated it into three factors – world, world ex-China and Top 8 exporters.
If we were to focus solely on the world figure, we would have a situation where we have a healthy supply.
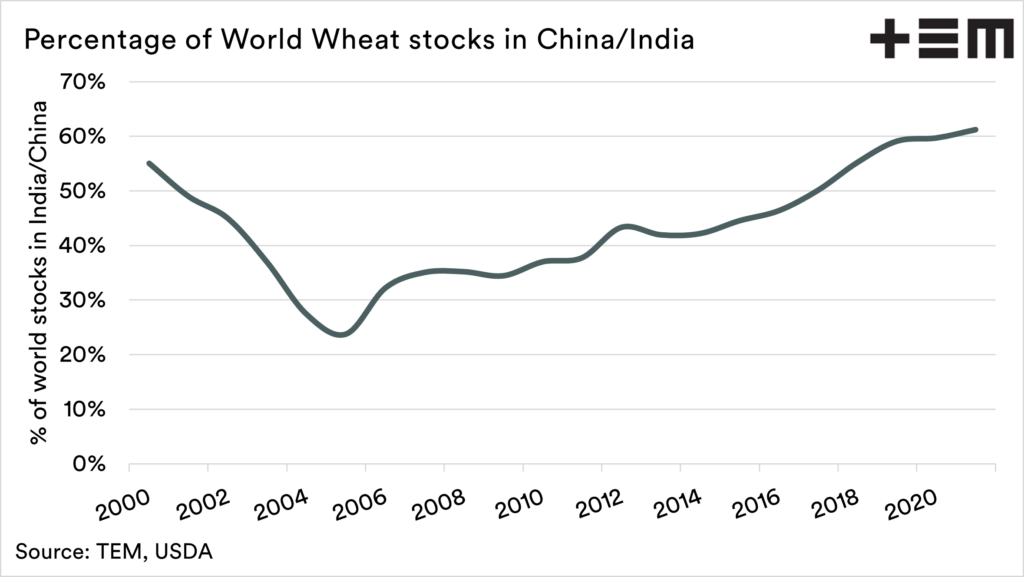
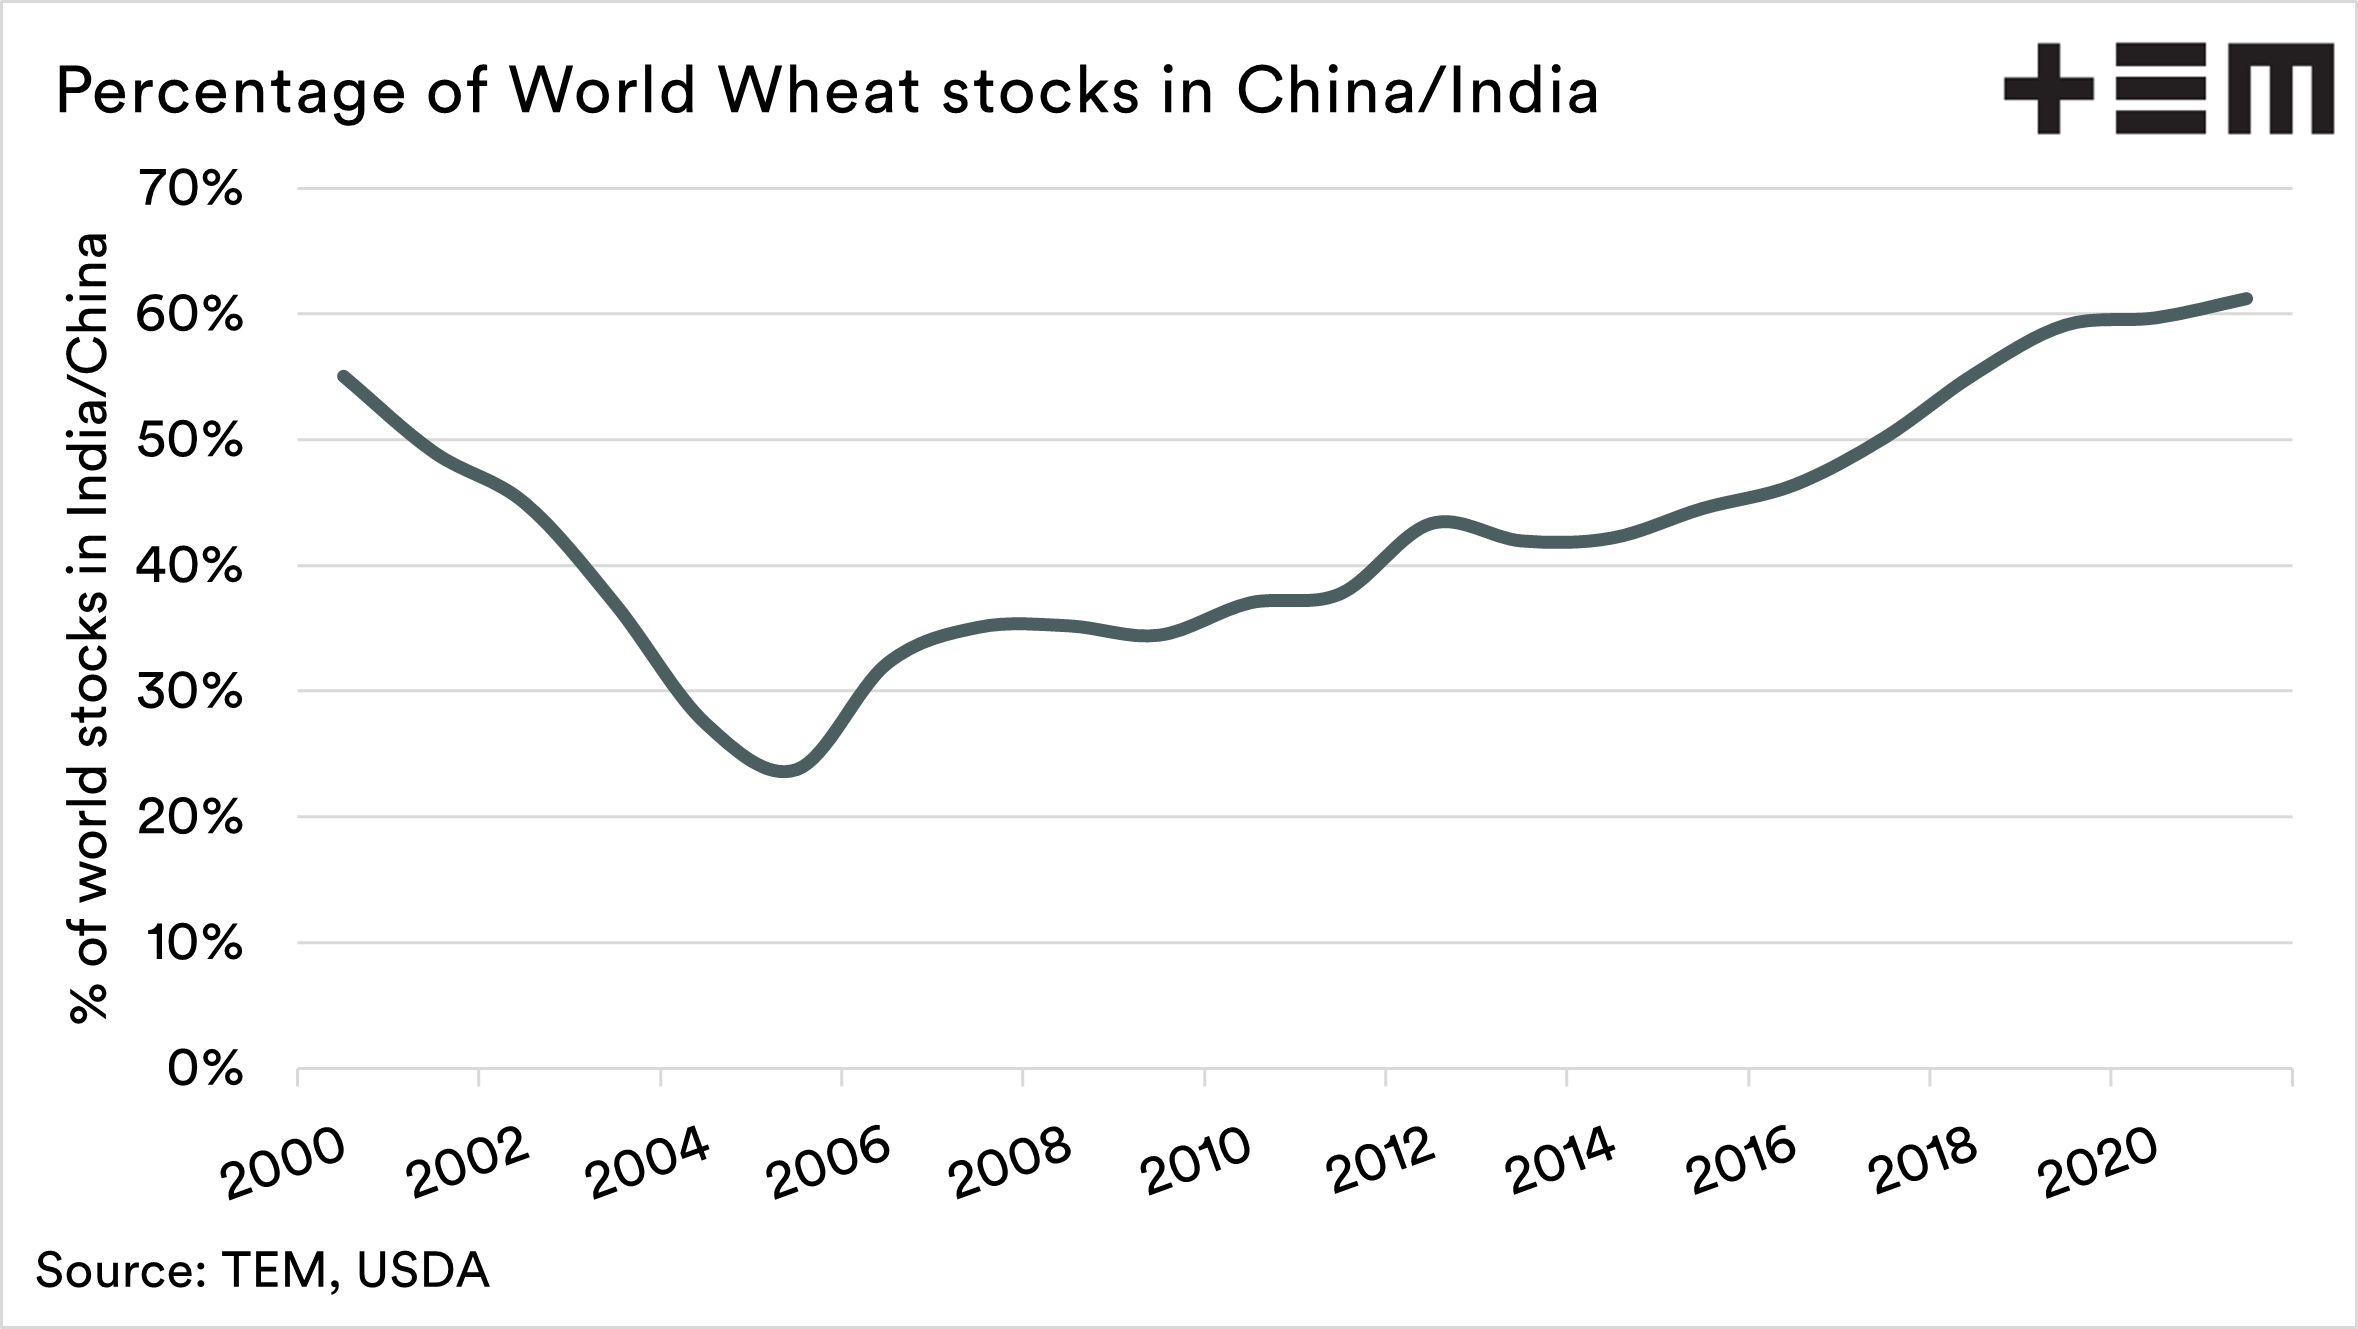
The reality, though, is that over half of the world’s wheat stocks are held in China/ India (at least on paper). The stocks in China are unlikely to be made available to the global market.
The stocks to use ratio of the worlds top 8 exporters has hit low levels, the lowest we have seen since before 2000. This could be considered that volume available to the market, and it’s low.
One thing to bear in mind is that the exporter ratio was at low levels in 2007, and by 2010 had returned to high levels. Although it is a slightly different environment, we have seen a more downward trend in the STU in recent times, compared to the sharp movements in the 2000s.
Fundamentally this is good news for Australian wheat producers, as it points to a tight environment, which is always helpful for pricing.