Market Morsel: More wheat fireworks

Disclaimer
Before I go in to start putting out what I think are the most important factors in the WASDE report, it is important to note that everything in the report is open to massive revisions in the coming months. The invasion of Ukraine has created huge uncertainty.
Stocks
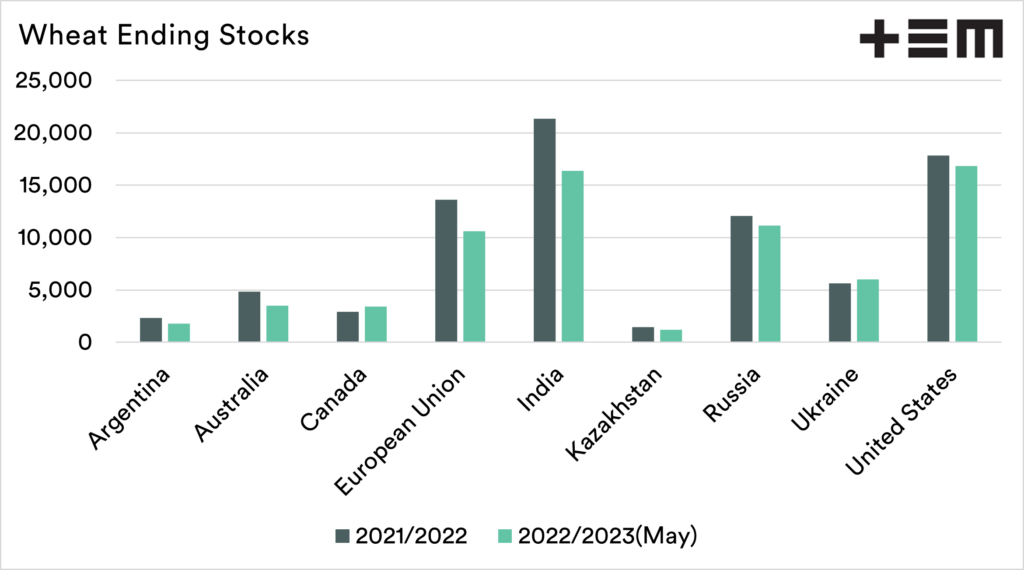
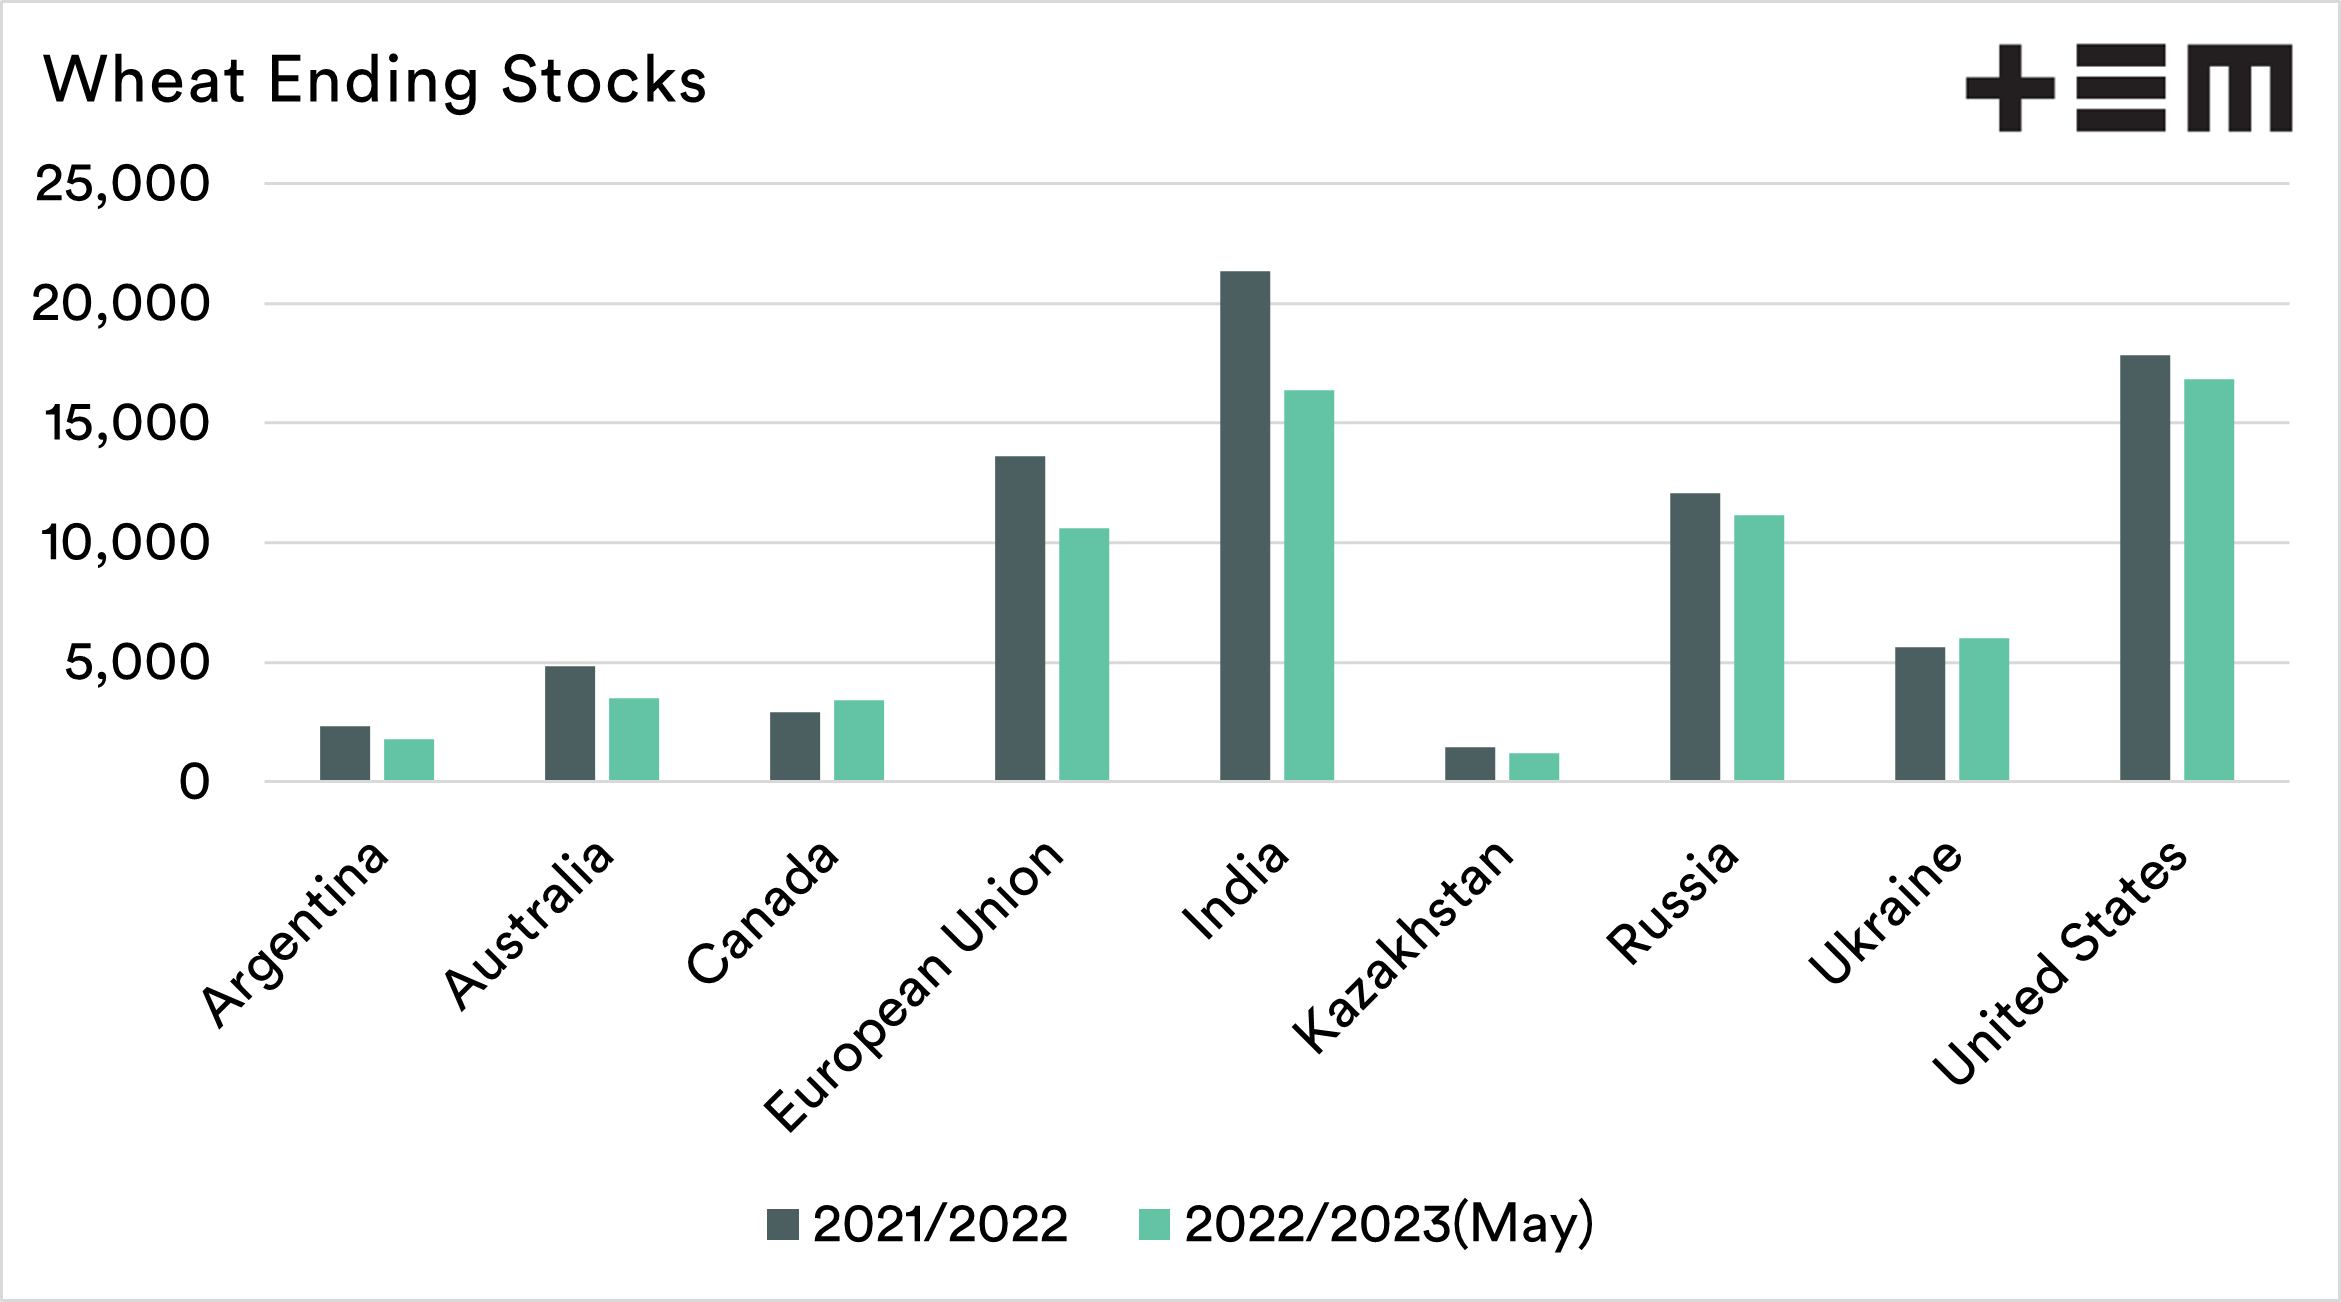
The world is getting tighter when it comes to wheat. World ending stocks for the coming season are set to drop 12.7mmt. These would be the lowest end stocks since 2016.
The chart below displays the wheat ending stocks from a selection of the world’s biggest exporters for this year and the projections for next. We can see the majority of them are going to be operating with reduced supplies by the end of the coming season.
India is experiencing a drastic reduction and may fall further due to cuts in production after recent dry weather not fully accounted for in this WASDE report.
Exports
Exports
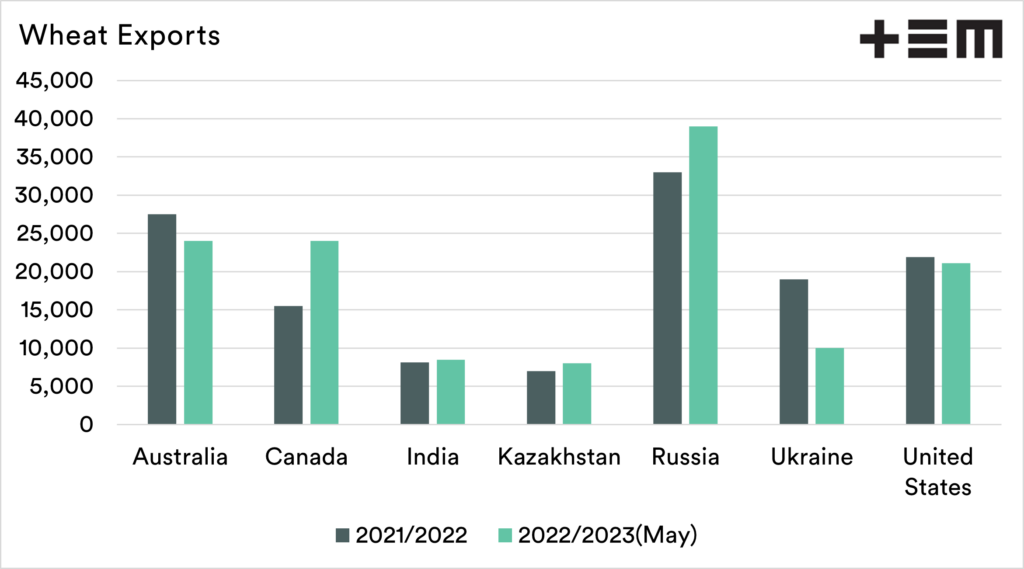
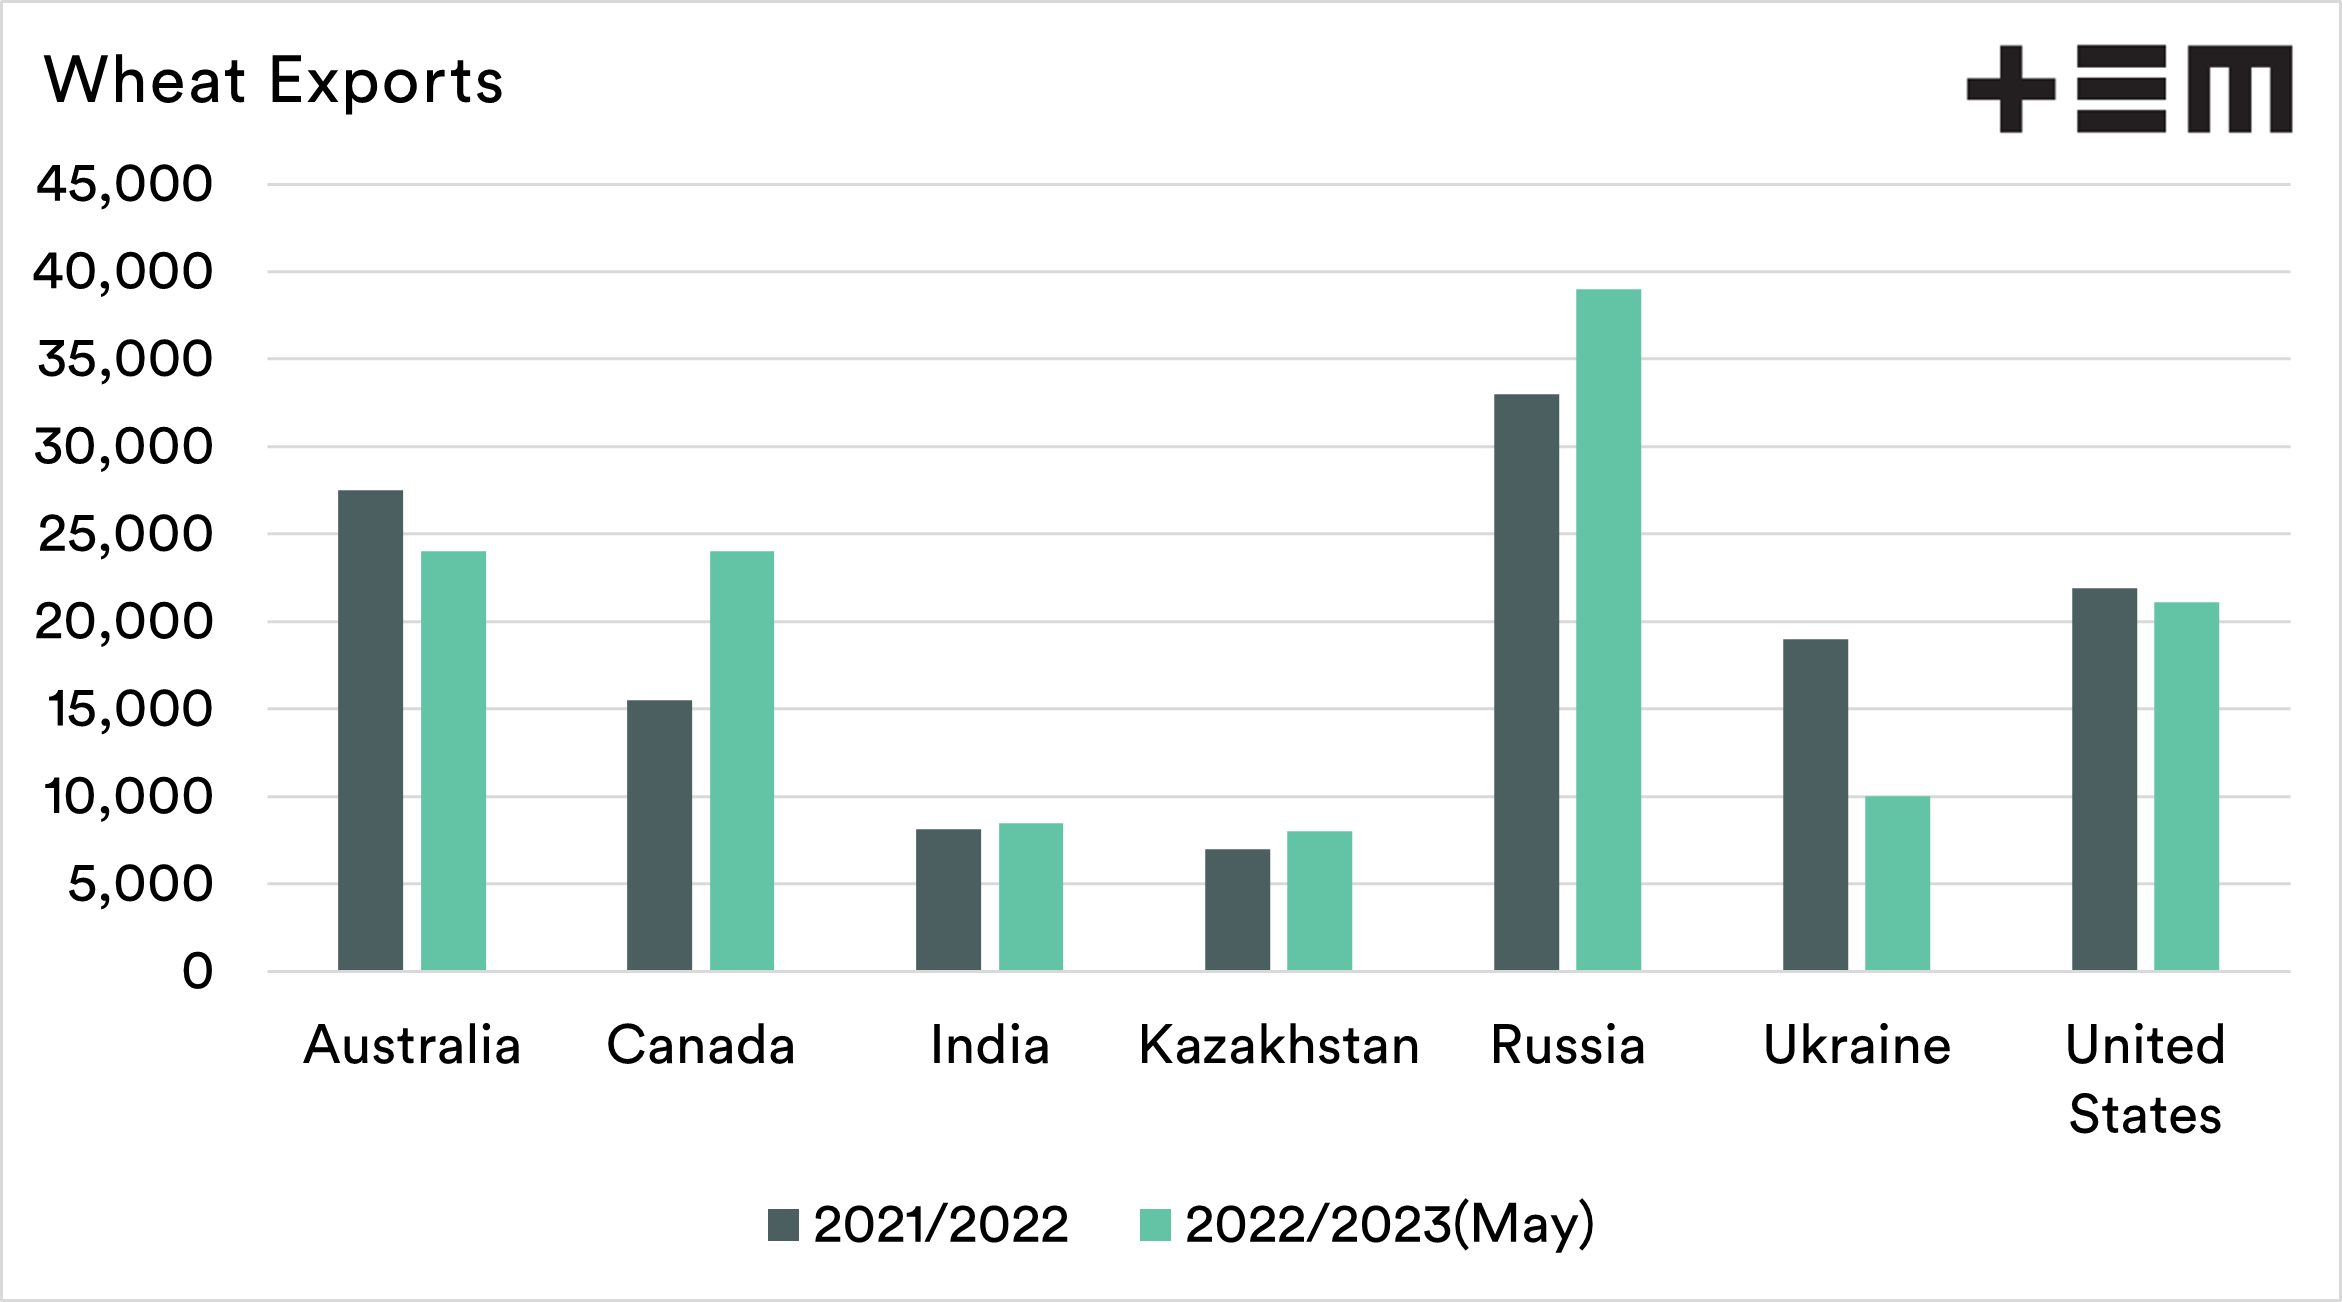
Wheat is a highly prized and priced commodity at the moment. The pricing is a signal for export nations to get ships loaded and out as soon as possible. This is leading to record-high exports on a global level. The main exporters are shown in the chart below.
A few points to note.
India – The USDA report was out before the ‘ban’ on exports of wheat from India. Exports, whilst not fully banned, are likely to be curtailed.
Ukraine – The USDA seems to be basing Ukrainian exports at around 10mmt, basically road/rail exports. It is important to note that even 10mmt overland from Ukraine would be a task. The assumption is a conflict that rages on, reducing export capacity through Ukrainian black sea ports.
The Global Picture
It is important to note that all of the forecasts for the world will be up for major revision. There are so many moving parts.
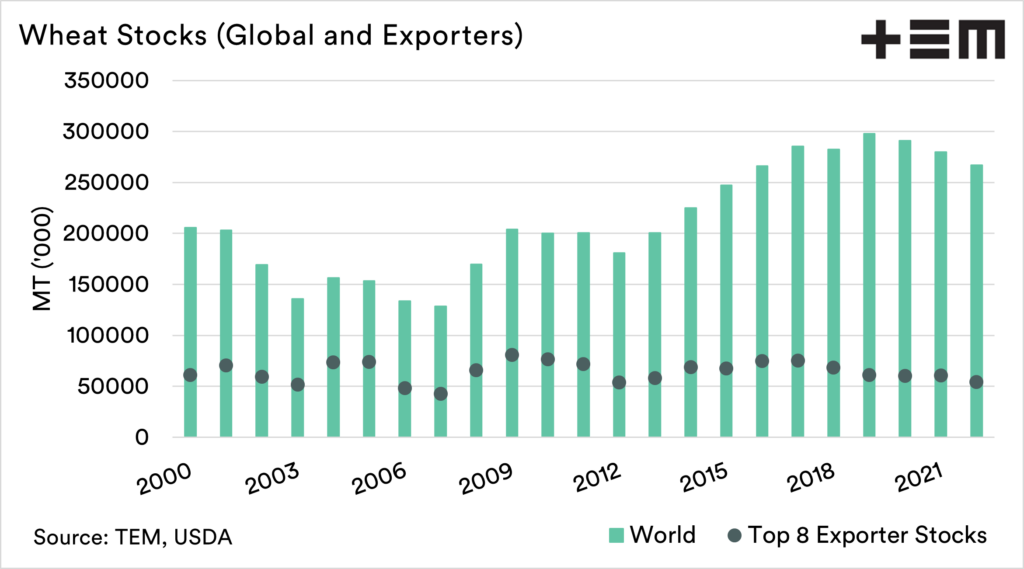
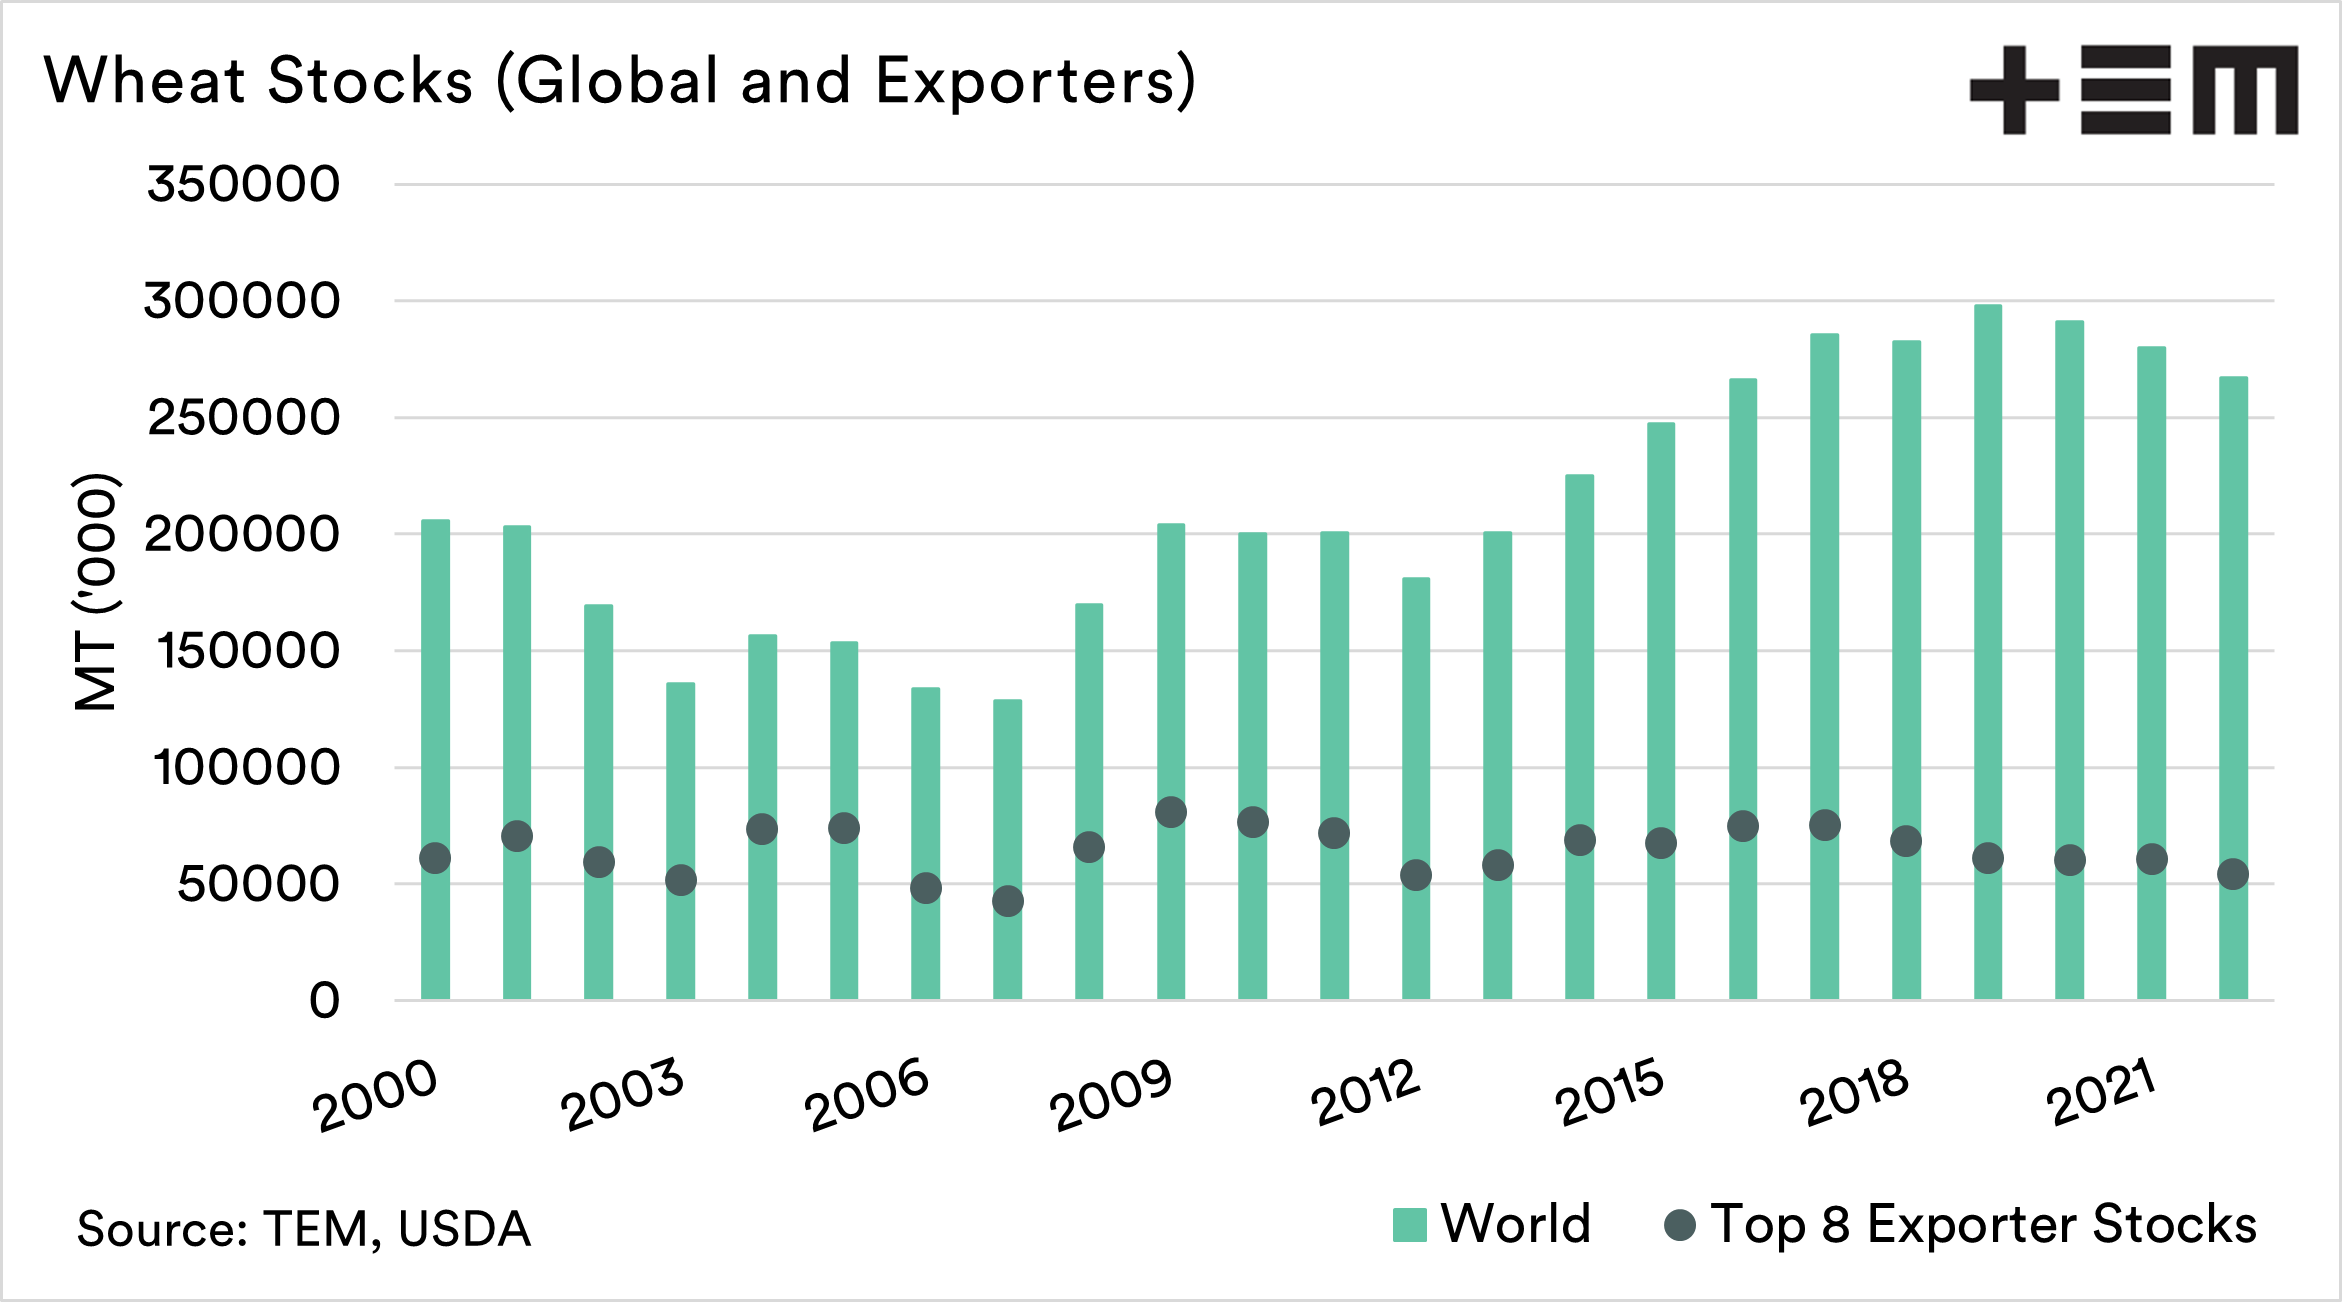
The first chart below shows the world wheat stocks, versus the stocks from the top 8 exporters. The top exporters are set to have the lowest stocks since 2012.
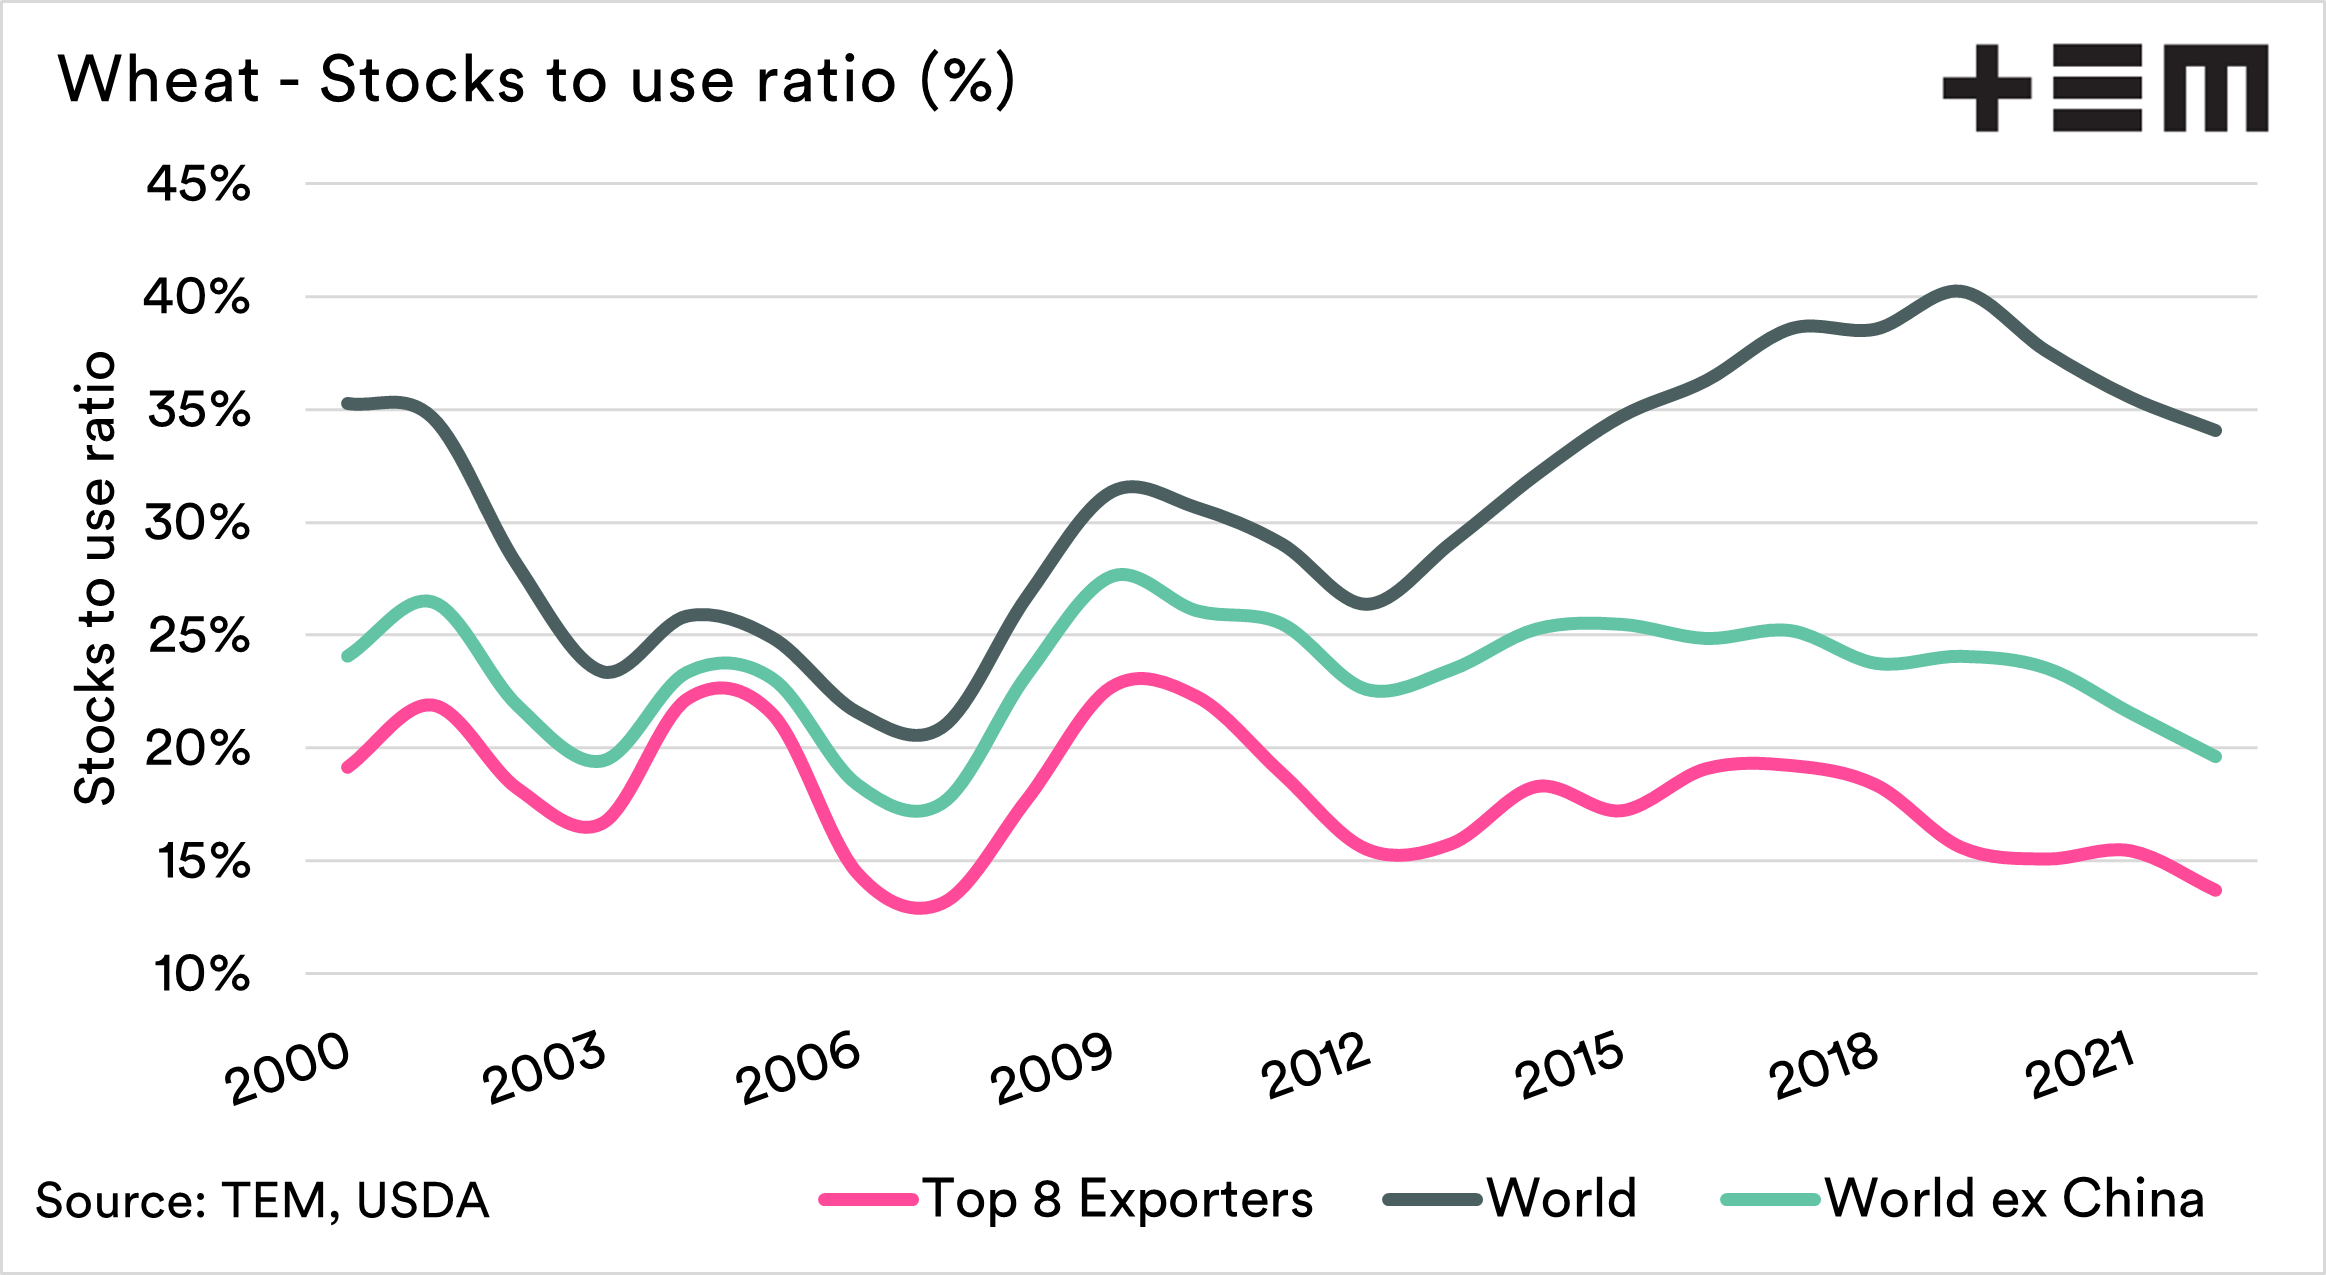
The stocks to use (STU) ratio is a good indicator of the relationship between supply and demand. The lower the STU the higher the price.
I tend to separate the STU to world total, world ex-China and top exporters. These give three distinct points of difference. The world STU is less relevant due to the high stocks (at least on paper) in China.
The top 8 exporters’ stocks are what is really available to the global trade, and it is low.