Market Morsel: Where is the grain?
Market Morsel
Today we covered the overall ABARES report and how the nation has performed in ‘The Olympics of cropping’.
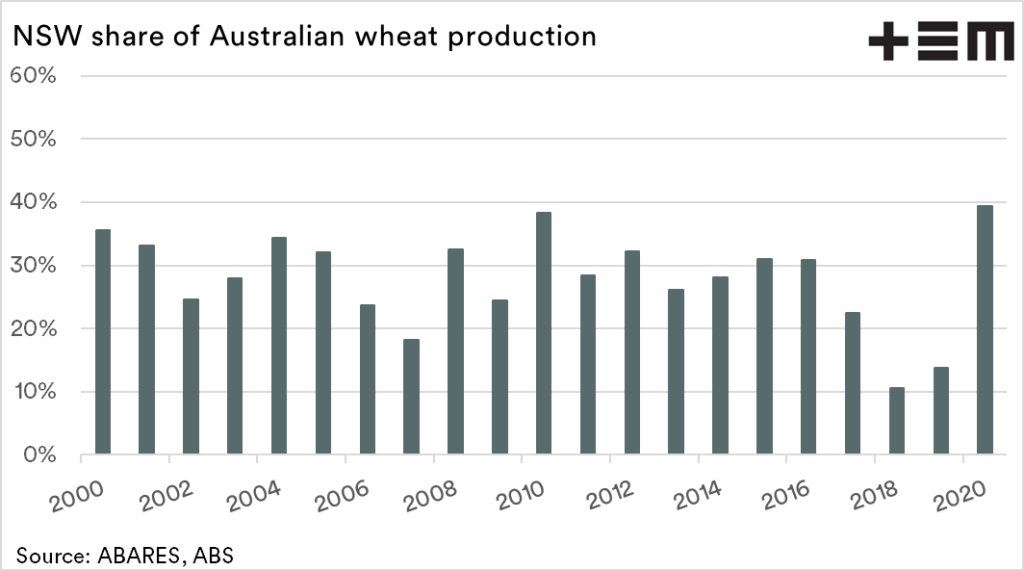
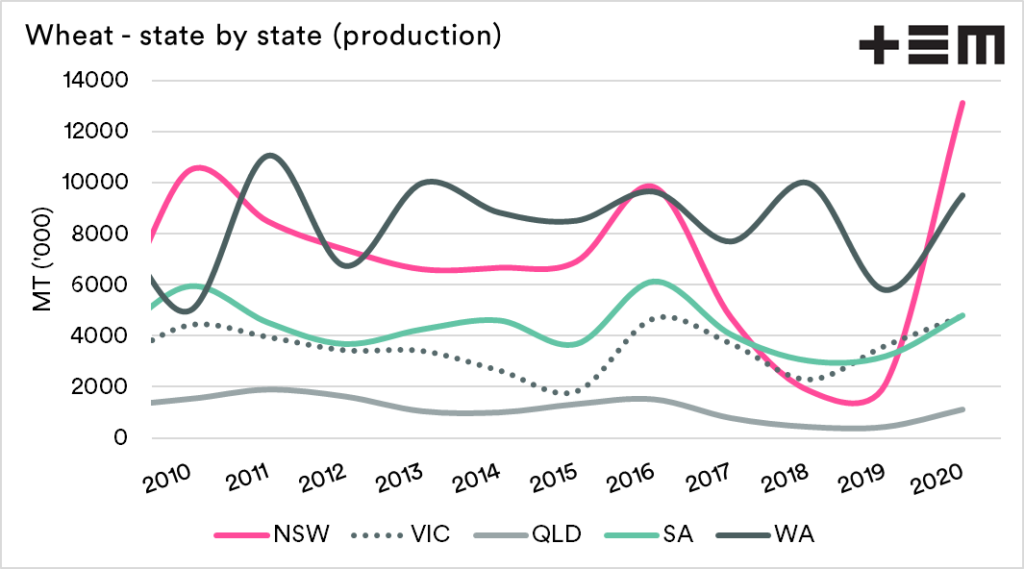
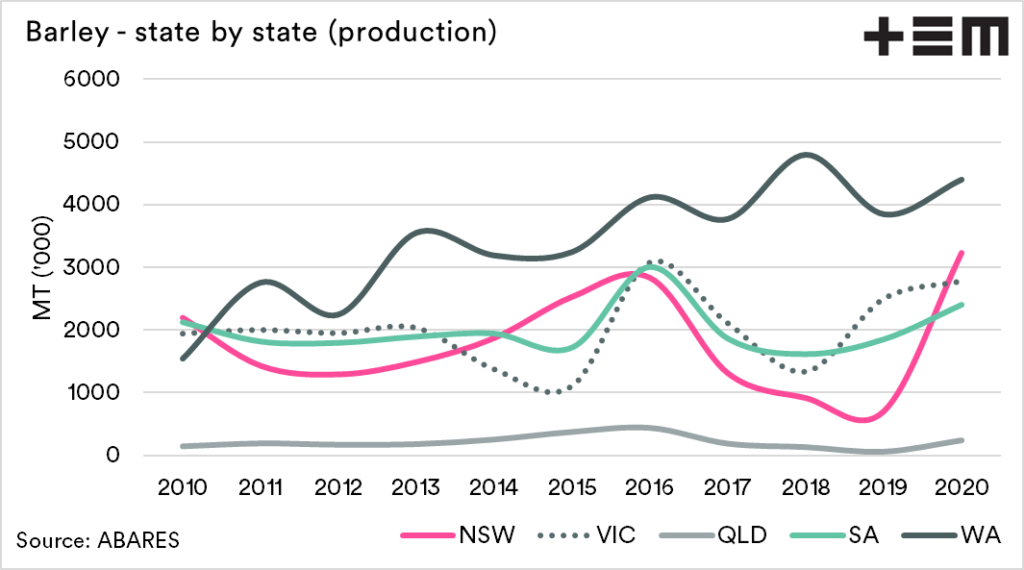
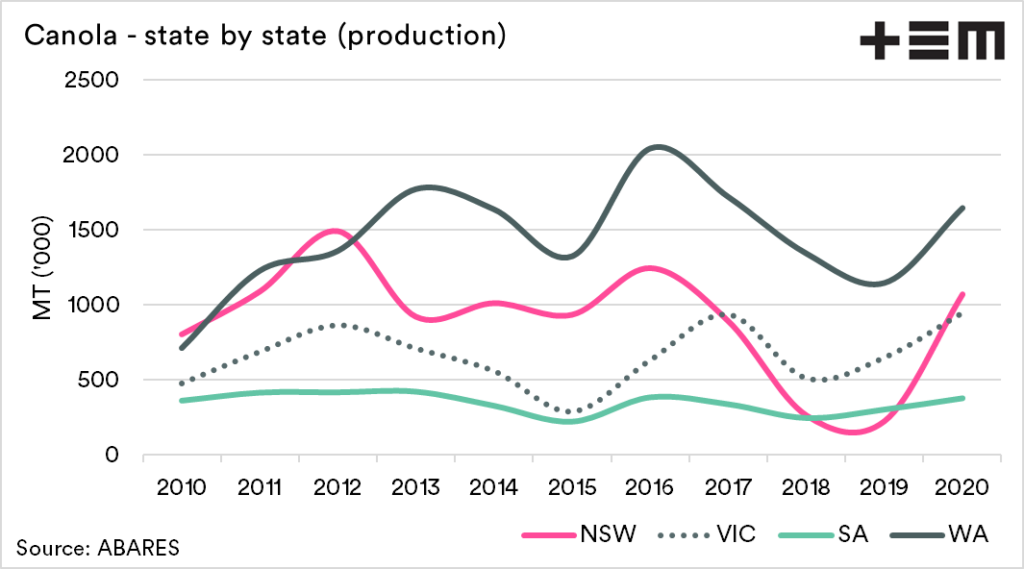
In this short piece, we will look at the state by state. The charts below show the production of wheat, barley and canola on a state by state basis.
The one takeaway from this data is that New South Wales has been the driving force of achieving the huge crop.
The rainfall has clearly been beneficial to the crop. The crop was also boosted by a high acreage and the benefits of what was effectively a long fallow in 2018 & 2019.
To see more in-depth charts, remember to follow our Twitter as we post throughout the day. Follow here

