
The US grain export program is setting a good pace

The Snapshot
- The USDA provide an insight into the export program of the United States.
- This gives an overview of the export pace for the major US grains.
- This year wheat is largely tracking previous years but has slowed down versus last year for the past two months.
- Corn and Soybeans are strongly up due to demand from China.
- This marketing year, the US has exported 47.2mmt versus 32.8mmt for the same period last year.
The Detail
At EP3, we are data-centric analysts. We collect data and then interpret it. For all their faults, the US Department of Agriculture produces a large amount of data which is extremely valuable for analysis. Unfortunately, the data available in Australia pales in insignificance.
One of the data points which EP3 collects on a daily basis is the weekly export inspections for the US. In this short report, I will explain what the data is, and outline the current situation.
The USDA compile on a weekly basis the volume of grain exported, and to which destination. This is an invaluable resource, as it provides an indication of the shipping pace.
This in turn, provides an insight into the level of volume leaving the US and is another piece of data which can shine a light of price movements. As an example, if exports remain healthy, then prices are liable to rise due to demand.
Comparable data at the same level is not as freely available in Australia and makes it more challenging to provide the same level of insight.
Let’s delve into the current situation with the major ag commodities.
This data is critical this year, as it provides an indication of the purchases made by China, as they aim to meet their phase 1 deal requirements.
In early 2020 China signed the ‘phase 1’ trade deal with the USA to purchase a target of US$36.5bn in agricultural produce during 2020, to bring a stalemate to the festering trade scuffle between the two giants. This target was an astronomical task considering that in 2017, US exports to China only reached US$23.8bn. If China were to achieve the objectives set, then US produce would have to be prioritised.
The charts in this article will display the seasonality of export inspections on a monthly basis, along with 2019, and 2020 export volumes.
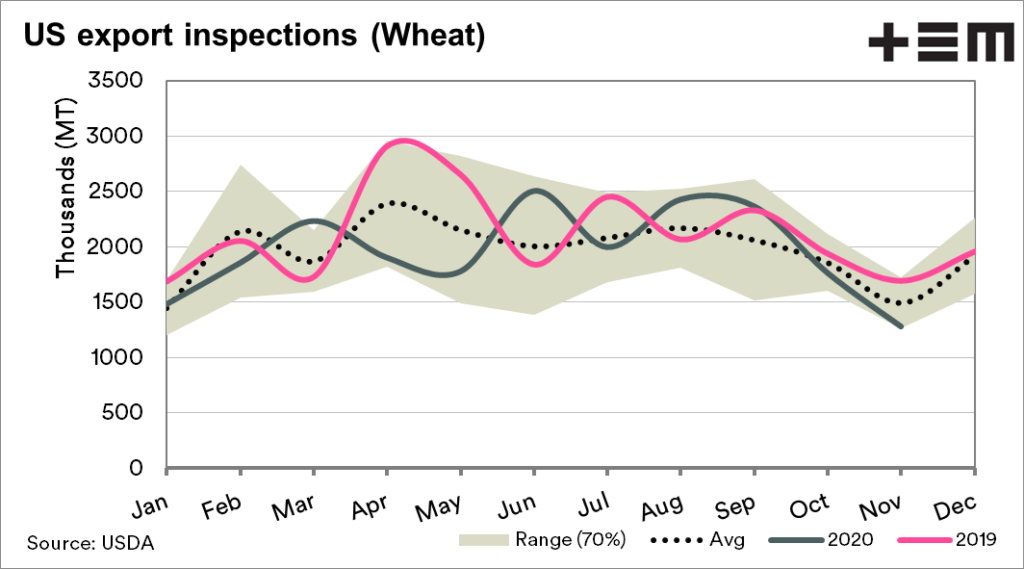
Wheat
Exports of wheat from the US have primarily followed the seasonal trend this year. In recent months volumes inspected for export have fallen below average, and are sitting at the bottom of the expected range for this period.
The overall volume of wheat exported for the marketing year to date (June onwards) is 12.39mmt versus 12.35mmt last year.
For all intents and purposes at this stage of the marketing year, exports are largely the same.

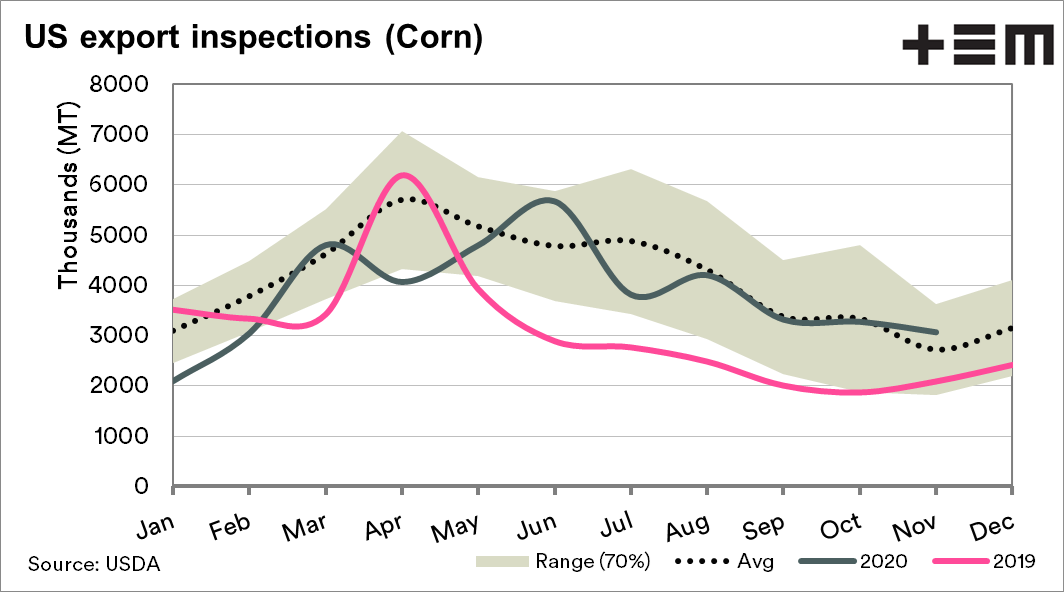
Corn
As we have discussed in recent articles, China has had an insatiable demand for corn. This has lead to a substantial export program from the US.
This marketing year (Sept onwards) has seen 9.2mmt exported versus 5.6mmt for the same period last year. This is a substantial increase, with the bulk heading to China.

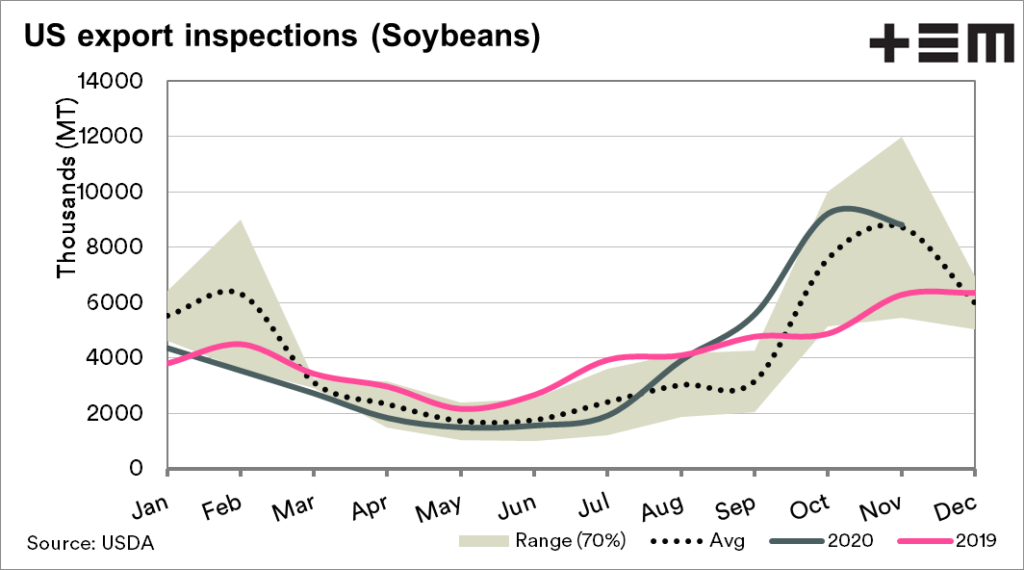
Soybeans
If China were to meet its phase 1 deal obligation of $36.5bn, then soybeans would have to be a central part of that strategy.
The soybean market has been on an upward trajectory in recent months, which has assisted the rest of the oilseed complex (canola etc).
This marketing year (September onwards) the US has exported 24.4mmt versus 14.4mmt for the same period last year.

Overall picture
To summarise, the US weekly export inspections provide detailed information on export flows of the major agricultural commodities out of the US. This provides a good source of information on demand and potential future supply issues.
This year agriculture exports are up strongly from the US. In total across all grains, 47.2mmt have been exported versus 32.8mmt for the same period last year.