Come sail your ships around me
The Snapshot
- As an export dominated industry, agriculture relies on freight.
- The cost of bulk freight has increased to decade-high levels.
- Container pricing has gone through the roof.
- The majority of the rise has been on freight out of China.
- The cost of moving our goods around the world is substantially higher than it was a year ago.
- Freight is expensive around the world, which will make geographic advantages more valuable.
- We have a geographic advantage into South East Asia compared to many of our competitors.
The Detail
When I first started working in commodities in the early 2000s, I was given one piece of solid advice; logistics is the key to the industry. I believe this advice is true.
I was lucky to gain experience in the supply chain, during the exciting period of the commodities boom of the 2000s. Whilst a different environment there are some similarities.
I regularly cover freight, as it has such huge ramifications for our competitiveness and the cost we pay for many of our imports from fertiliser to fencing supplies.
In this article, I wanted to cover off the pricing environment for both bulk and boxes.
Bulk
The bulk freight market is extremely important for grain growers, as the majority of our grain will leave these shores on bulk vessels. Conversely, the majority of our fertiliser will come into the country on a bulker. Let’s take a look into it.
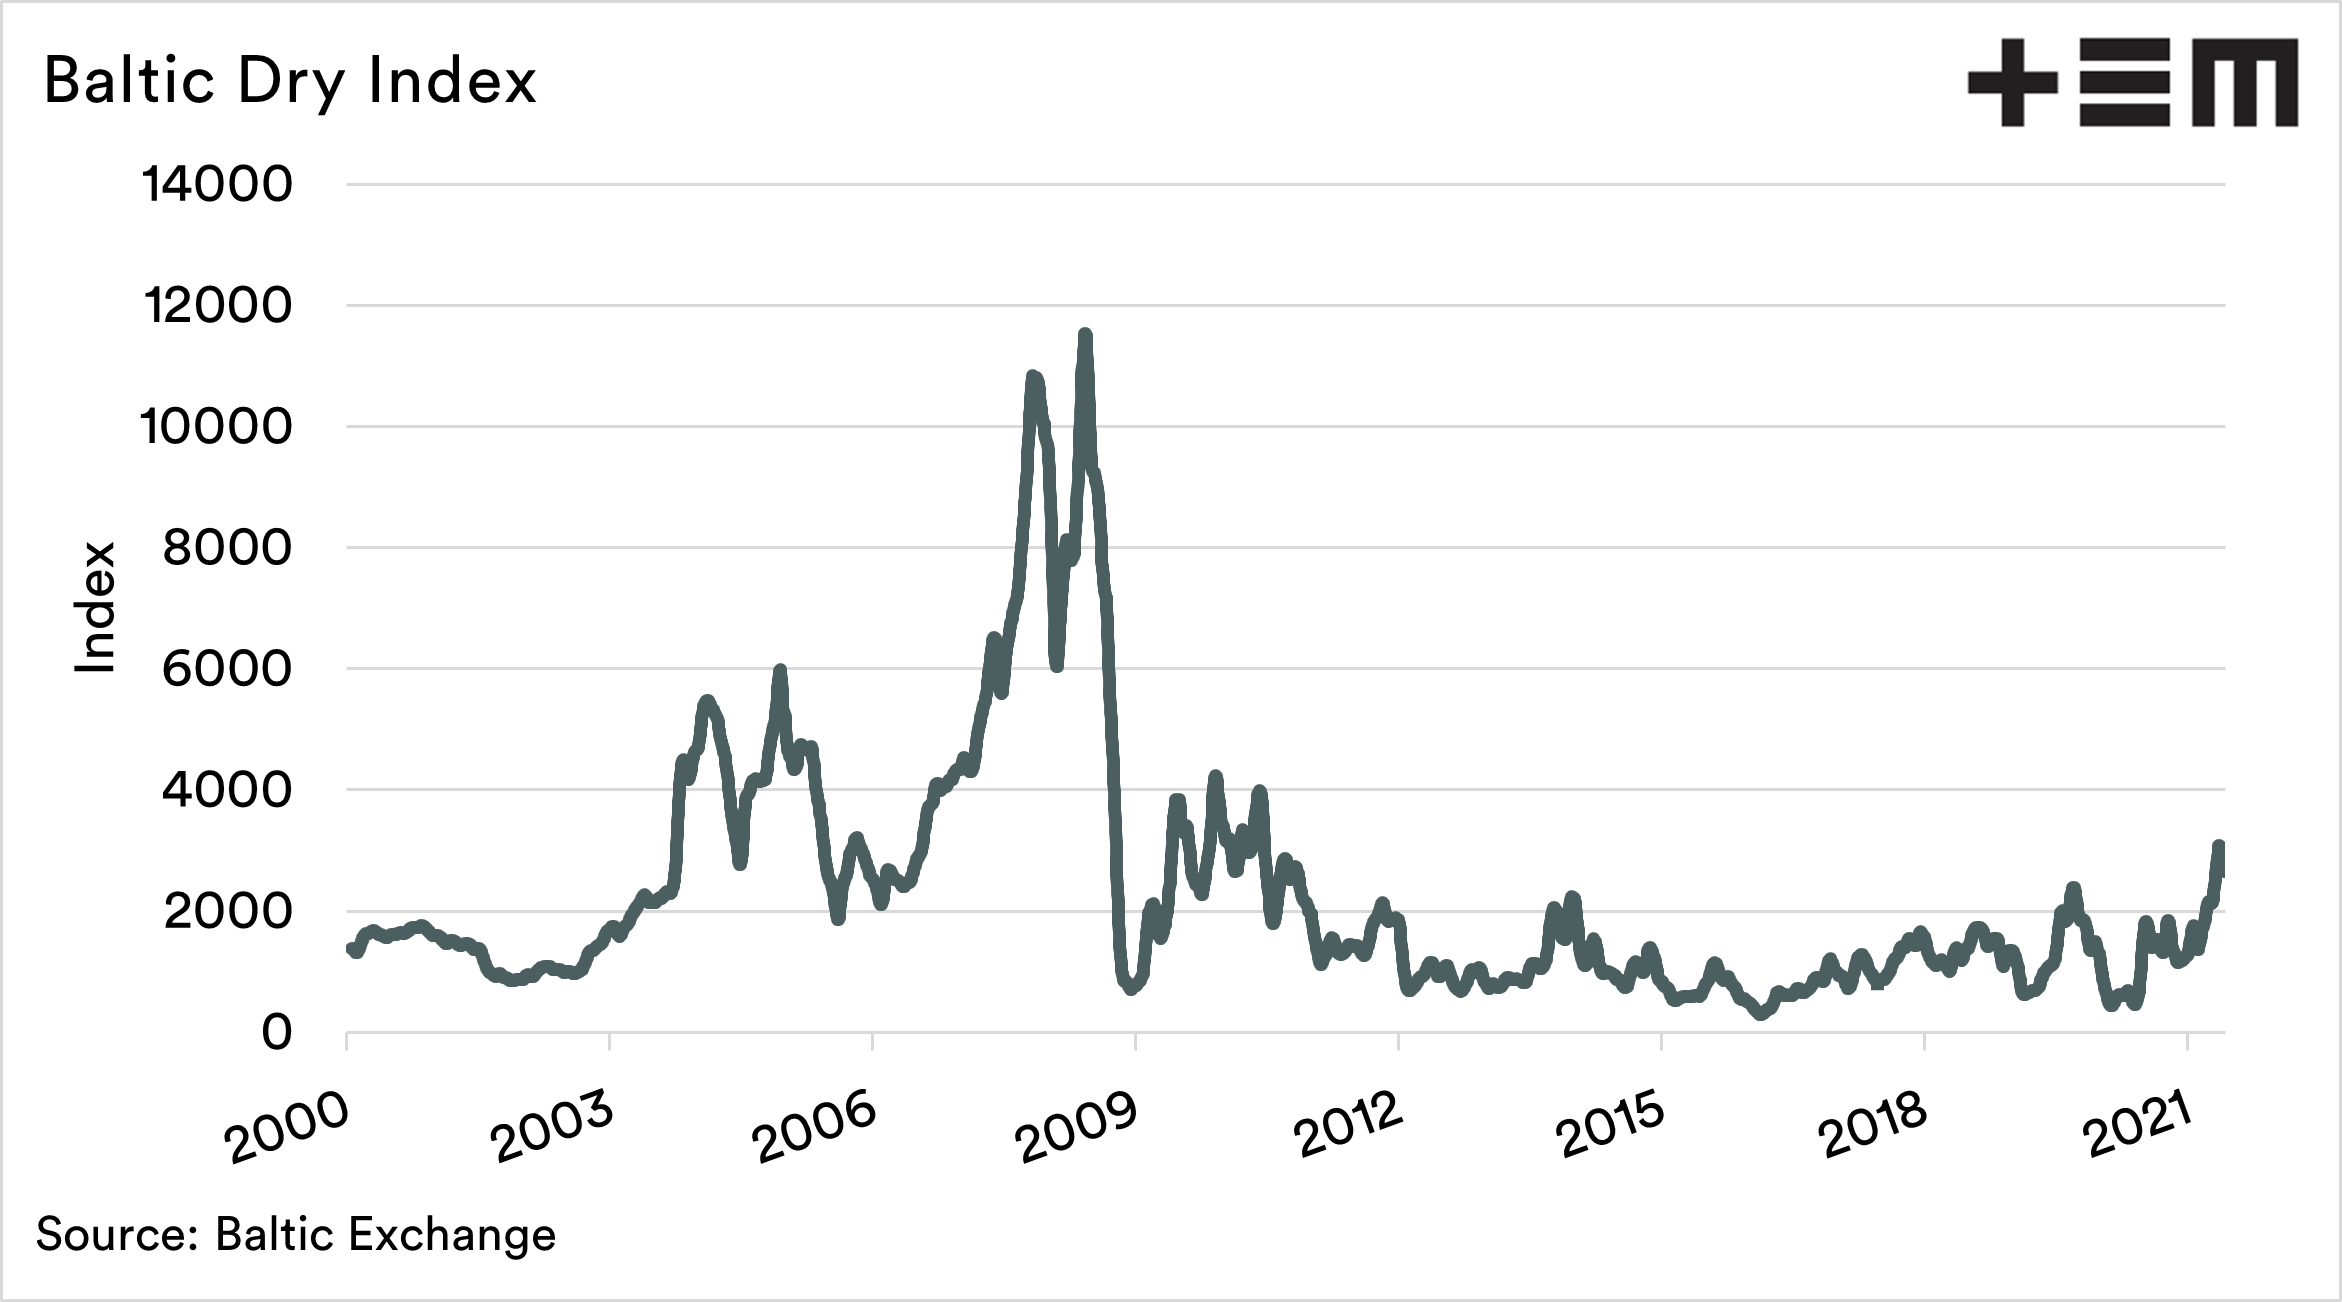
The Baltic Dry Index (BDI), is the first port of call when getting an overall picture of the bulk freight market. To understand the BDI of it and its equally alternate purposes, read ‘The Baltic Dry Index‘.
The BDI has reached levels not experienced since 2010. The BDI has increased because demand for raw commodities has increased dramatically, as economies attempted to rebound from the COVID lows last year.
This has been assisted by government assistance to stimulate the economy in China. The result is rampant purchasing of nearly all commodities from iron ore to corn.

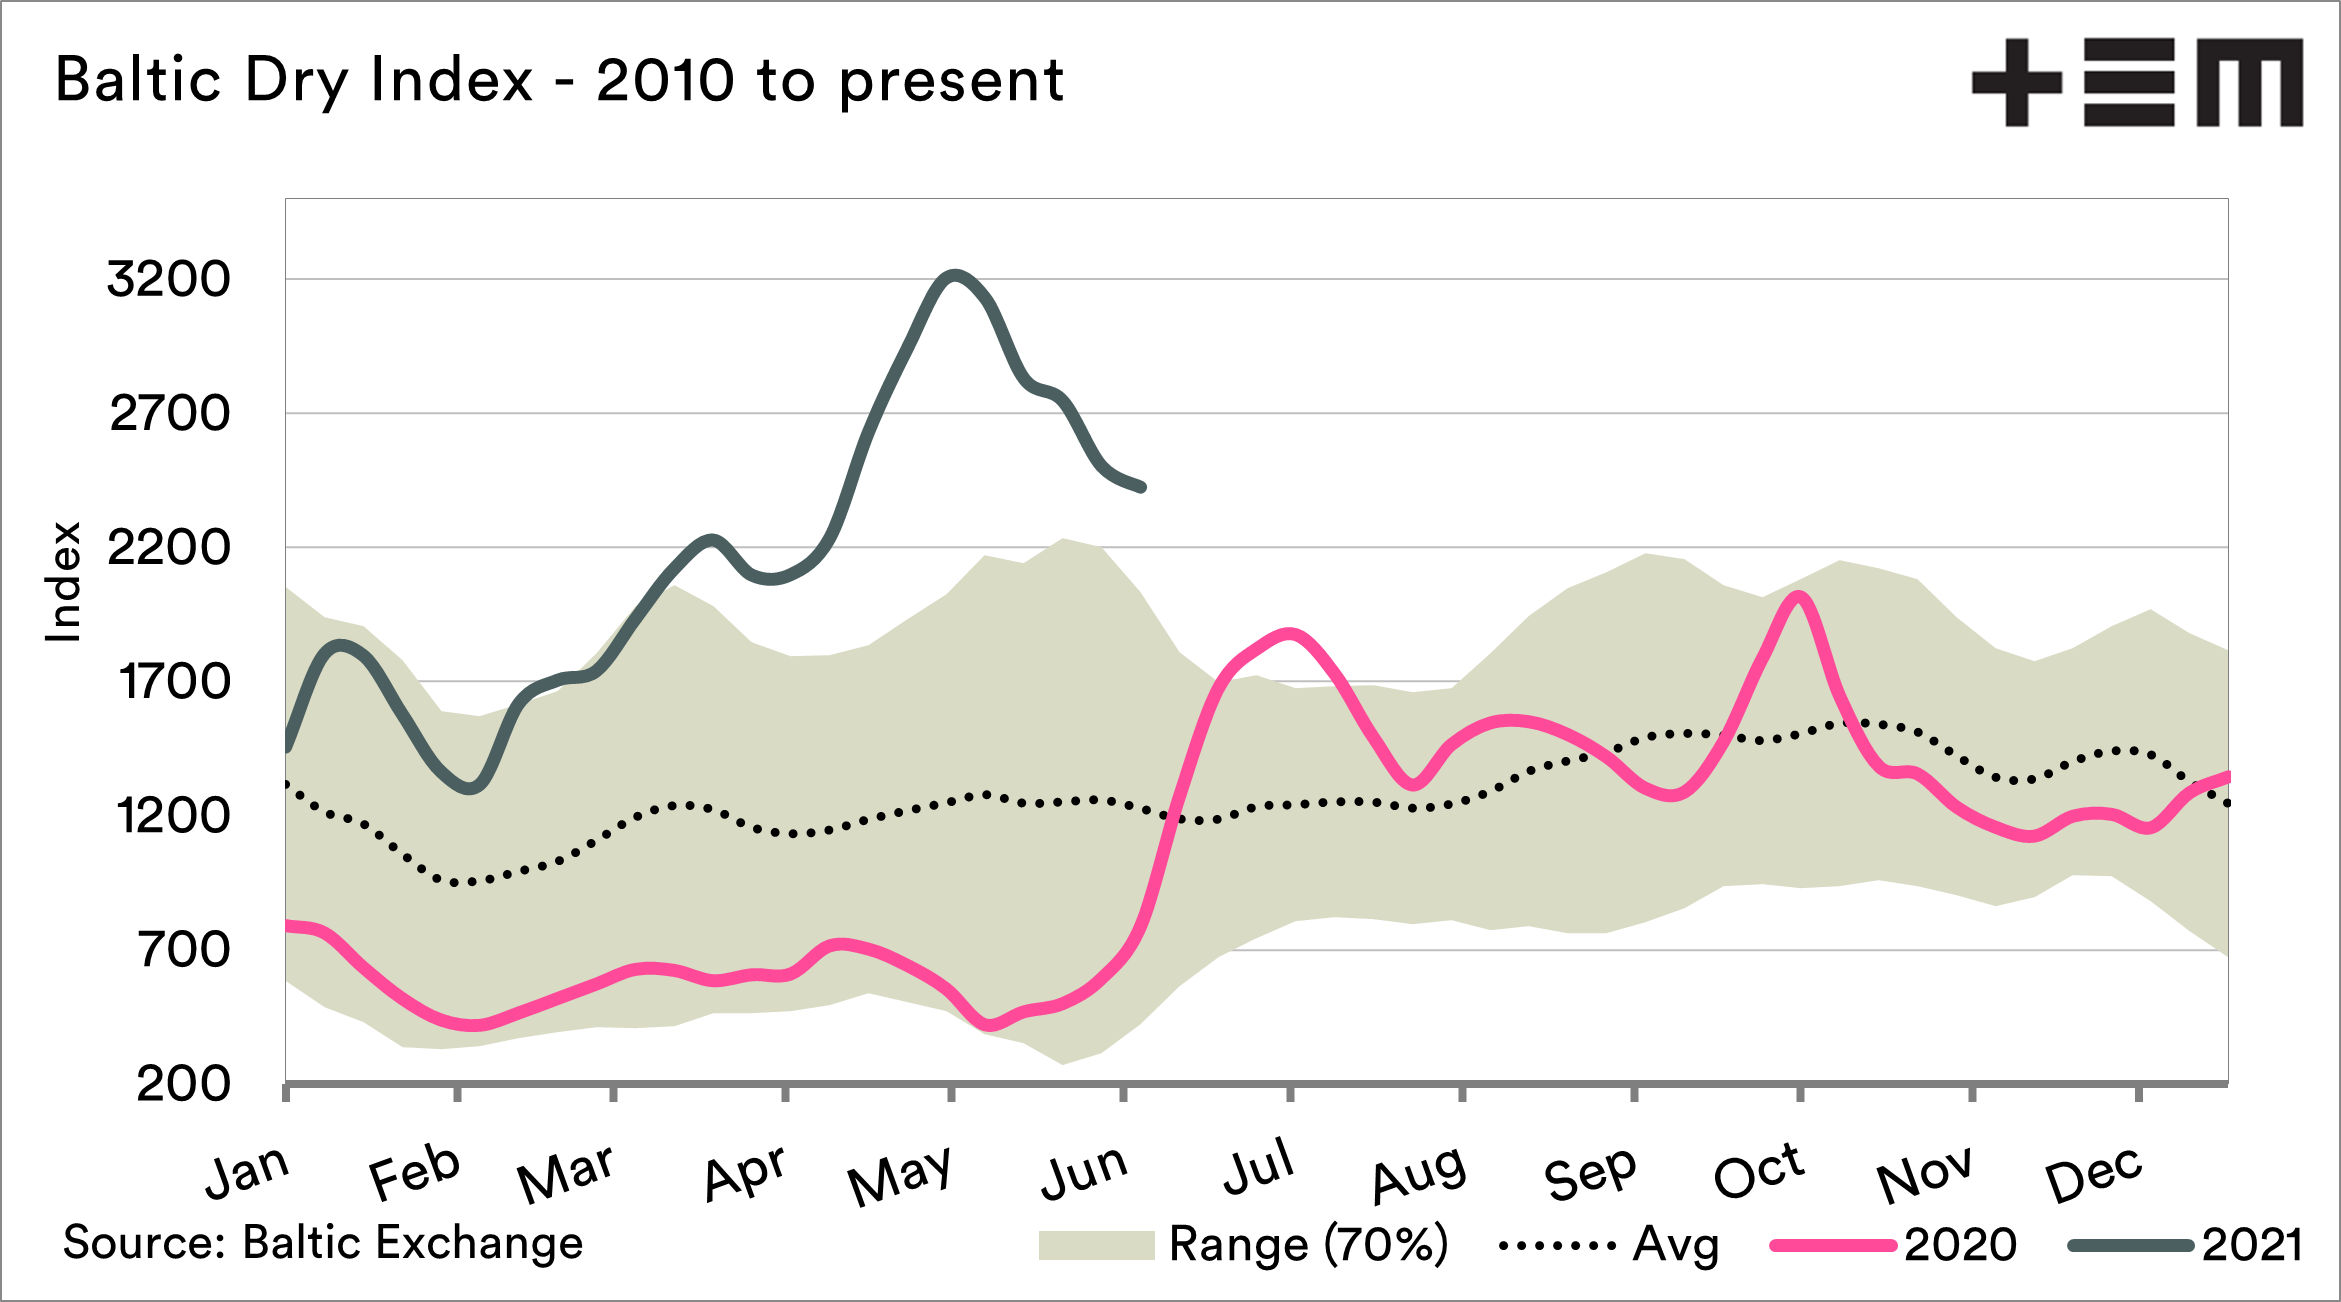
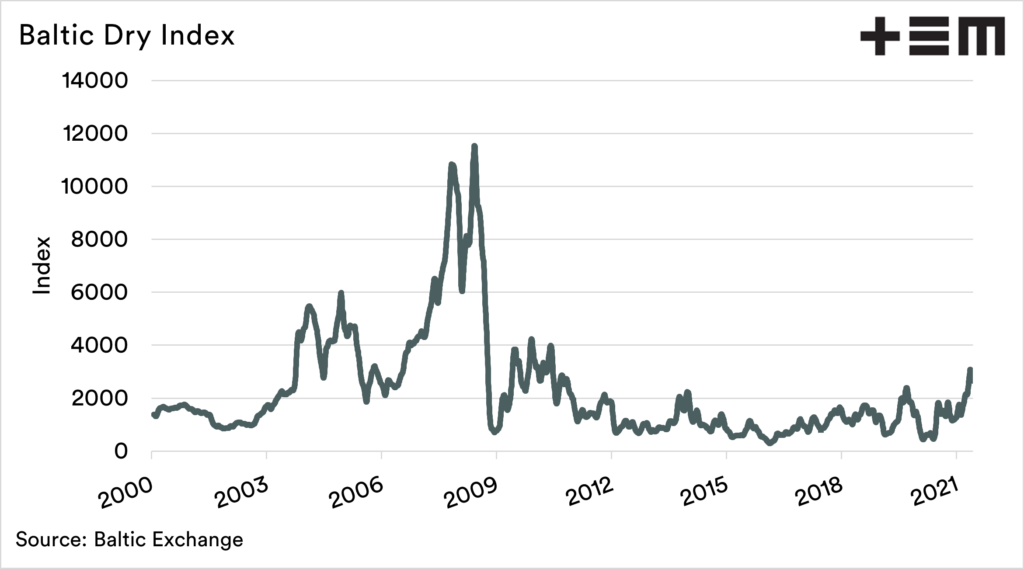
The reality is that whilst the BDI has risen rapidly; it still remains well below the heady days of the commodities boom of the mid-2000s. At that time, commodity demand went through the roof, and then it crashed with the GFC.
The result was that many shipowners during the boom had expected those pricing levels to be the new norm and commissioned new vessels. These vessels mostly came online after the pricing had fallen. A lesson to us all, to be fearful when someone calls the market the ‘new norm’.
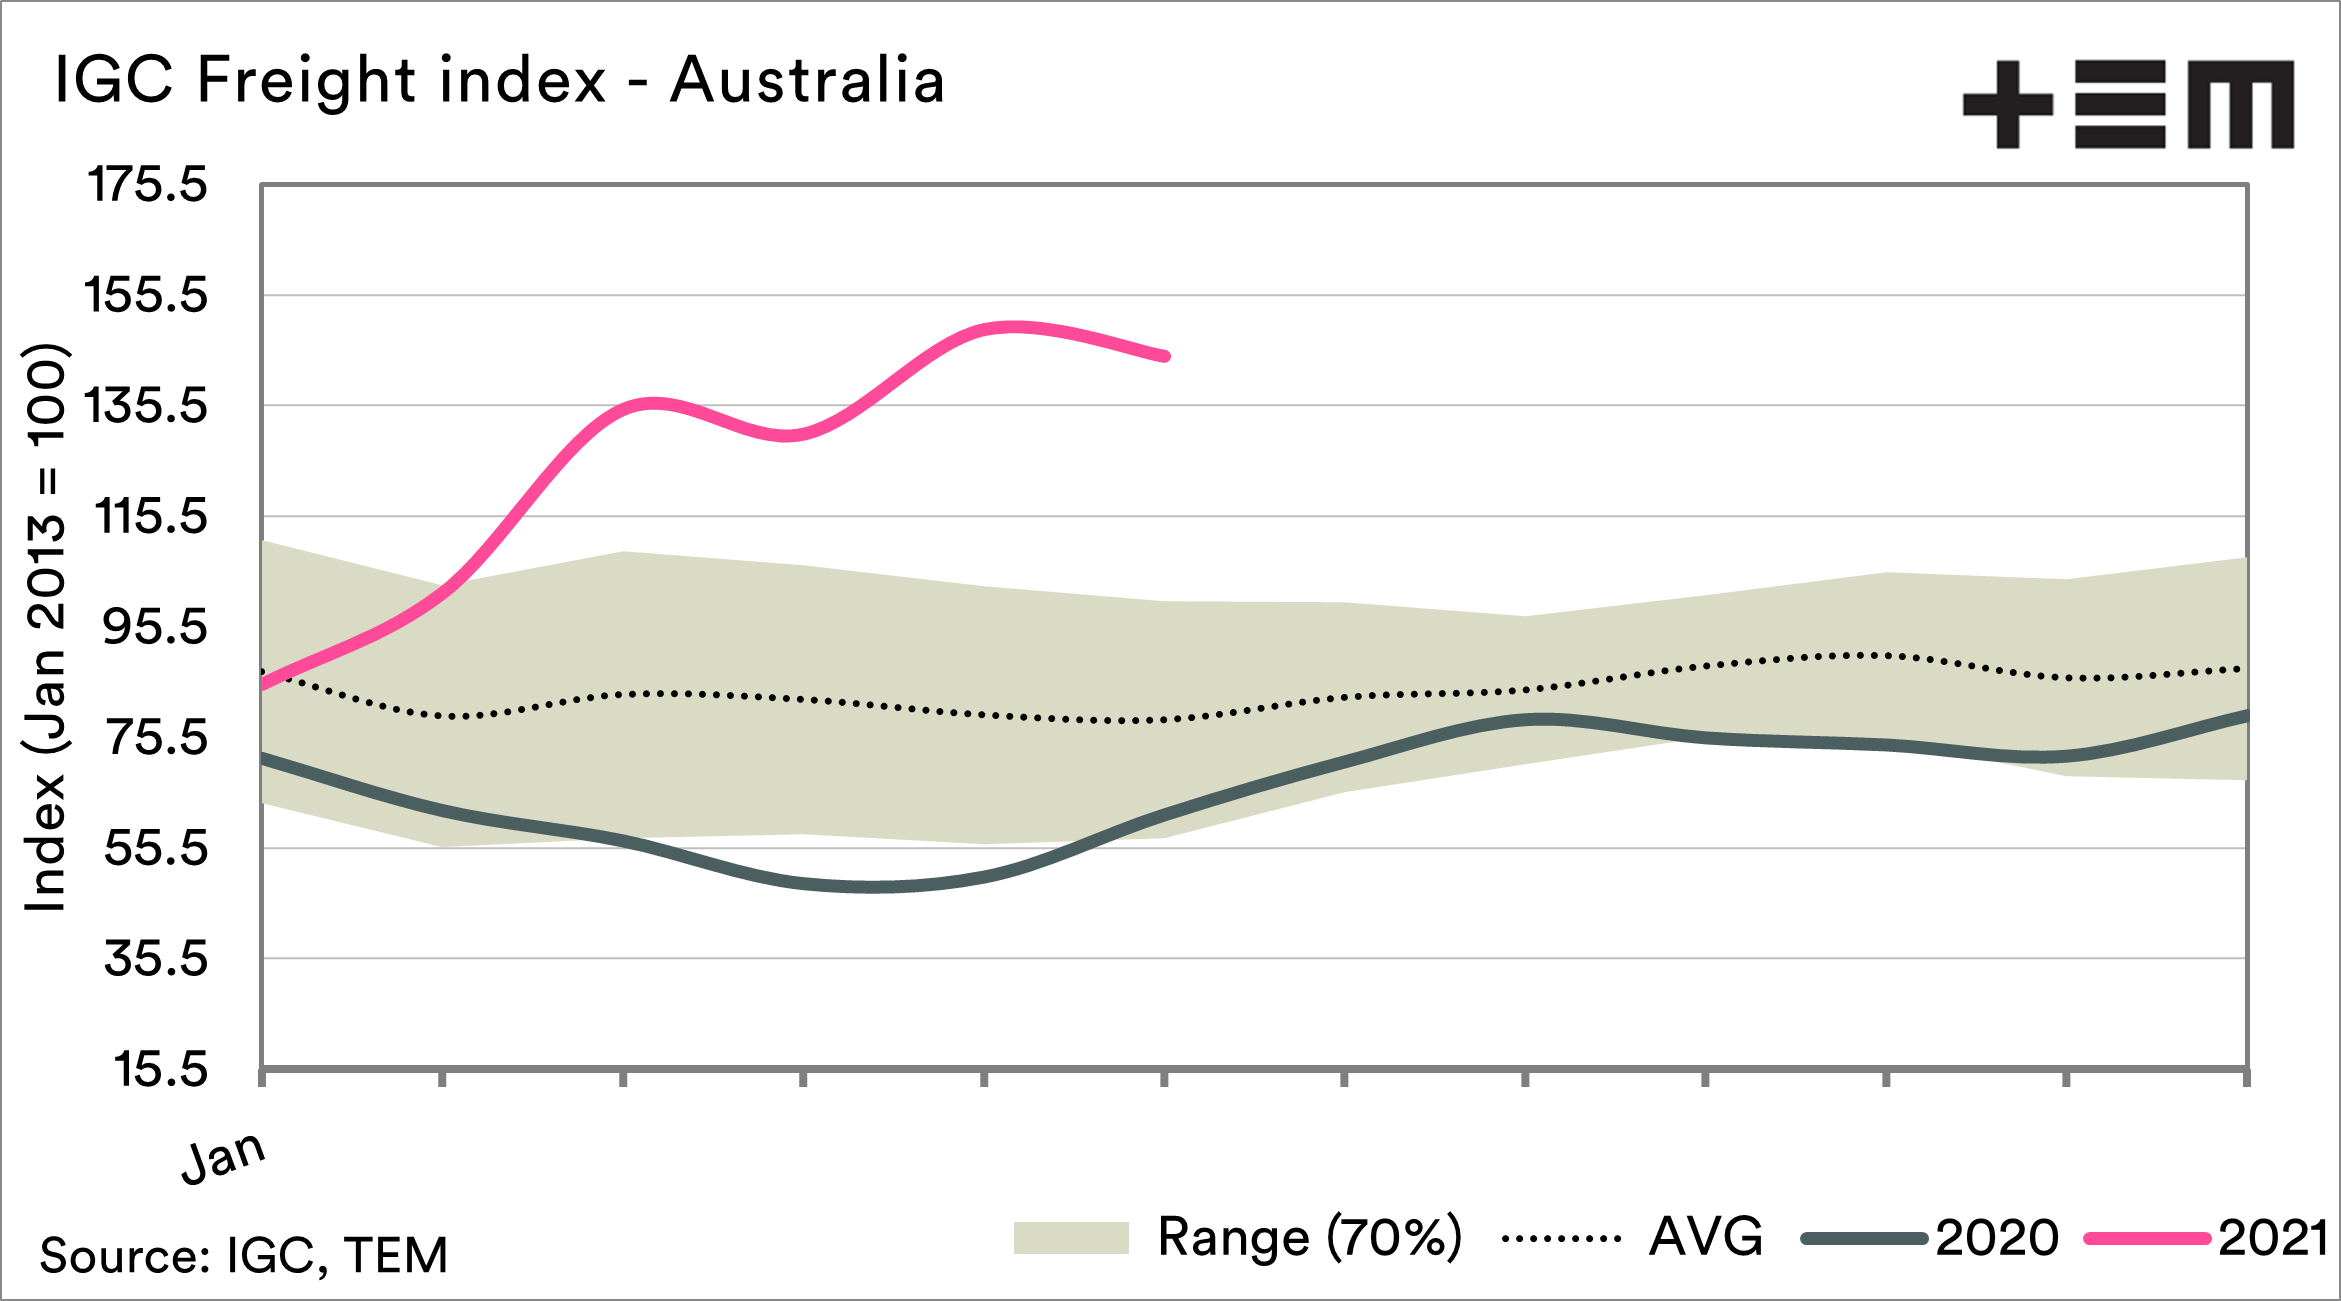
The International Grain Council also maintains their own series of indexes for freight rates – but specifically tailored towards grain from the main origins.
This data only goes back to 2013, but last month reached the highest level in that time. This indicates that the cost of exporting and importing to Australia is high.
These high prices for bulk freight are shared around the world. This means that the greater the distance, the bigger proportion of the cost of export goes onto freight. This means that we have a competitive advantage to south-east Asian countries due to our relative closeness.

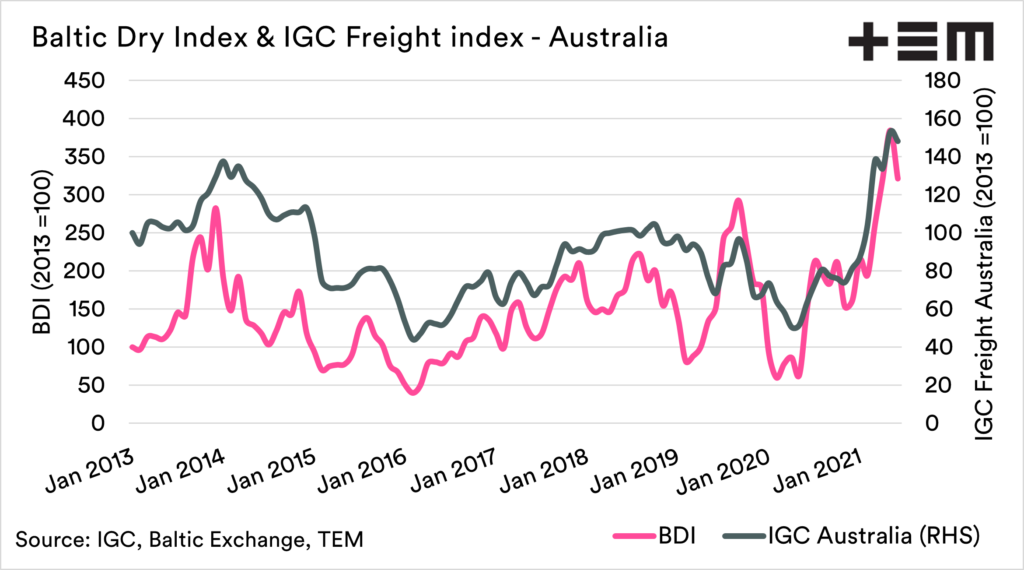
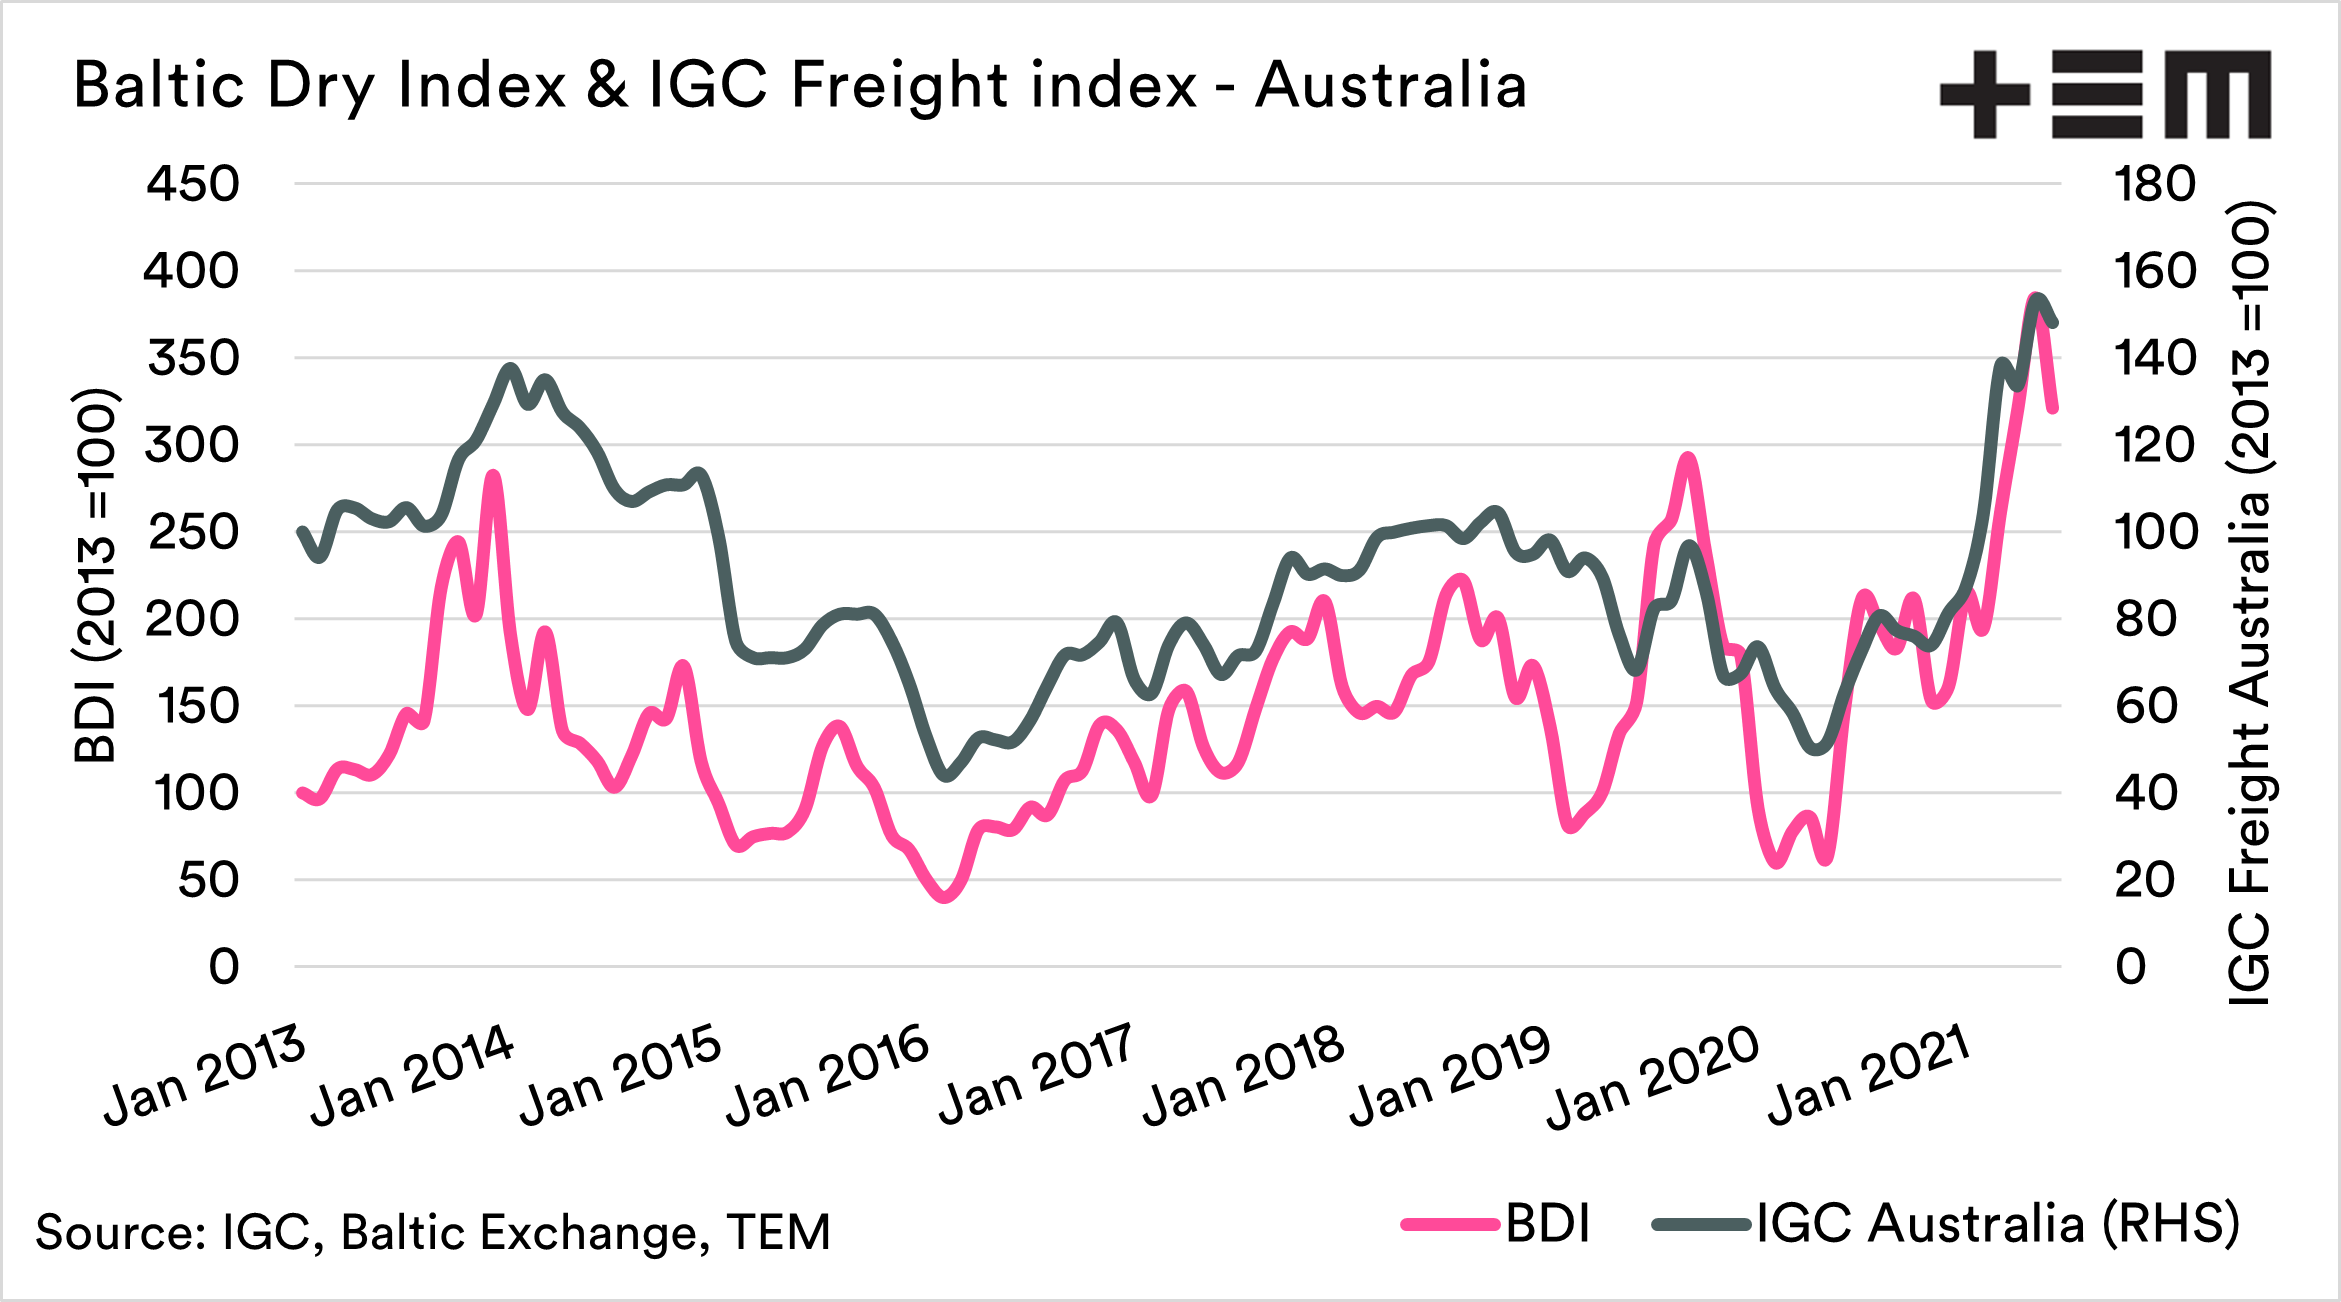
The reality is that both the BDI and IGC index follows the same trends. The chart below shows the BDI, converted into a further Index starting in 2013, along with the IGC Australian freight index. These indexes unsurprisingly follow one another with a close relationship.
Therefore, we can use either the IGC or the BDI as an indicator of the trends in freight costs. However, it is worth noting that the BDI is provided daily versus weekly for IGC providing a quicker market view.
Boxes
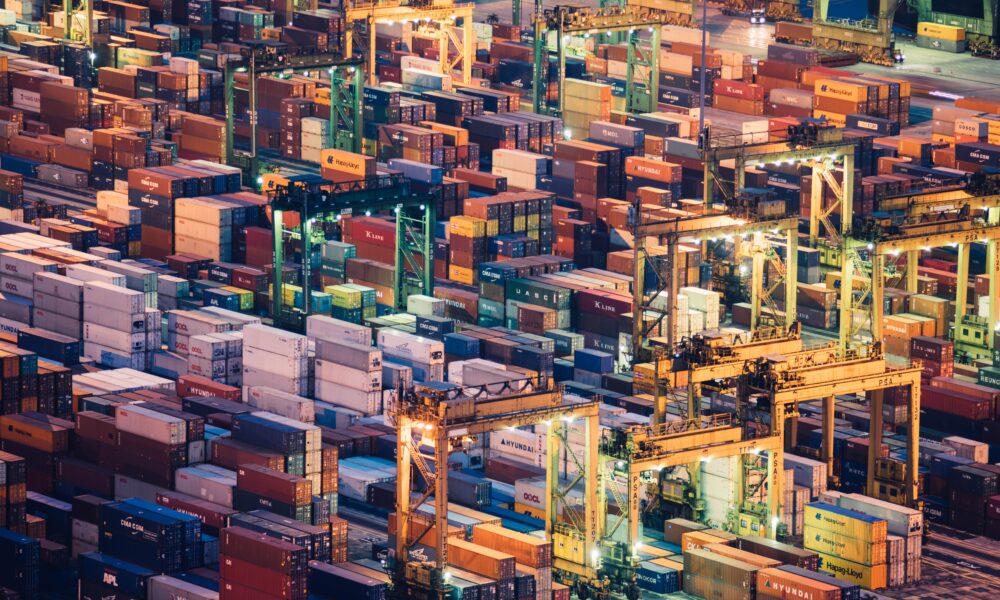
Boxes (or containers) are the backbone of the global economy. They move almost all the finished products which require, and also many of the useless trappings of modern life.
Whilst finished products are one of the items filling boxes worldwide; there are plenty of commodities going into them.
Our meat, wool and reasonable quantities of grain and pulses head to our destination markets in boxes. The box market has gone crazy this year.
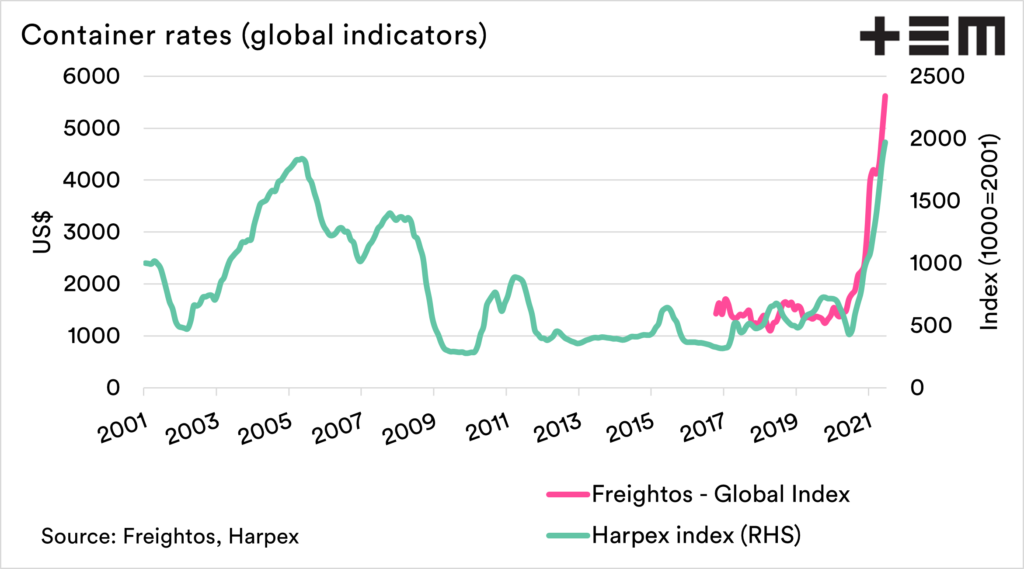
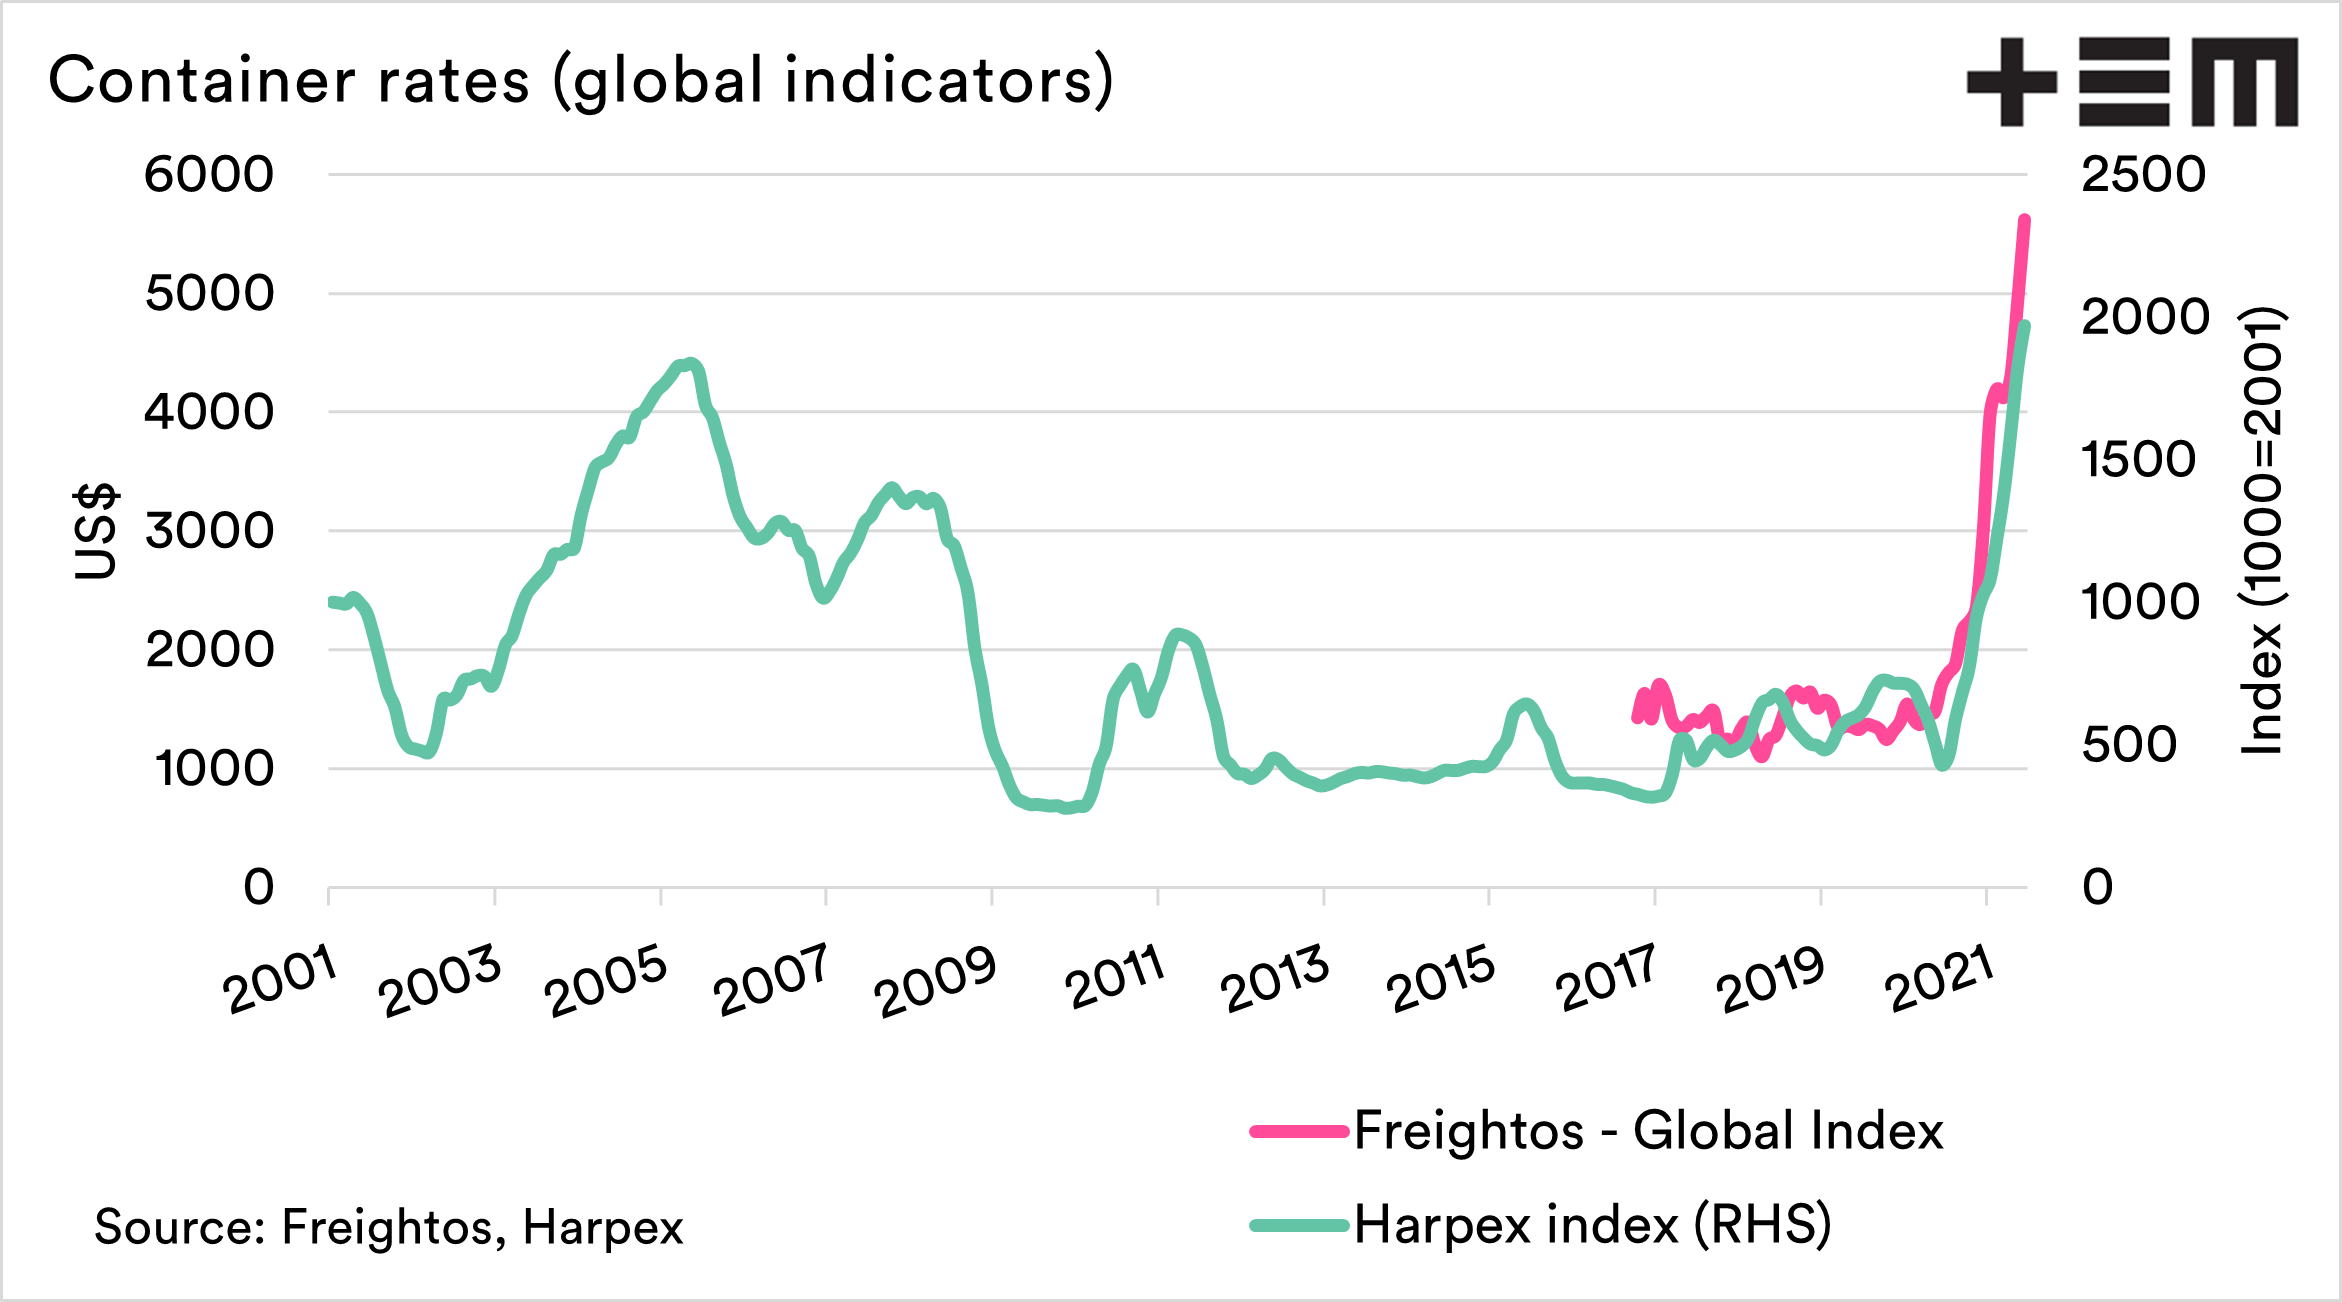
The chart below shows the Freightos global index and the Harpex index . These two indexes both provide a representation of container pricing on a global level. The Freightos has only been in existence since 2016, and Harpex since 2001.
Using the Harpex index, we can see that container rates are at the highest level since 2001. The current global rate for a 40 foot container is US$5929 (A$7700), a far cry from the first week of June 2019, when the rate was US$1300.
This is, however, not the whole story of container pricing……….
The rise in the container rate has been experienced throughout the world. Still, the rise has not been uniform – not all are created equal.
When we delve into the routes that make up the freightos index, we can see that container rate rises have favoured certain routes.
The largest rises have come from routes out of China, as opposed to into China.
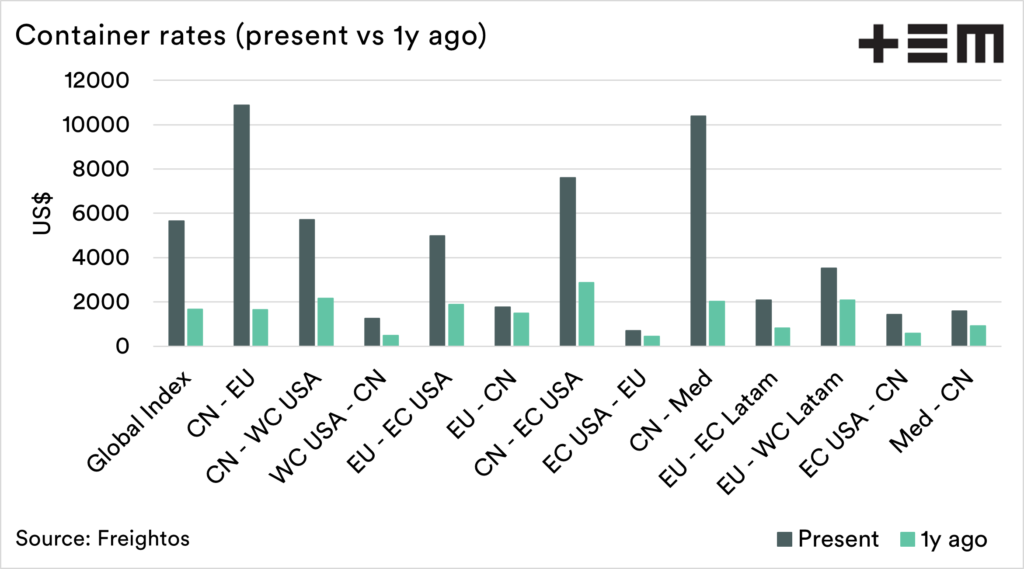

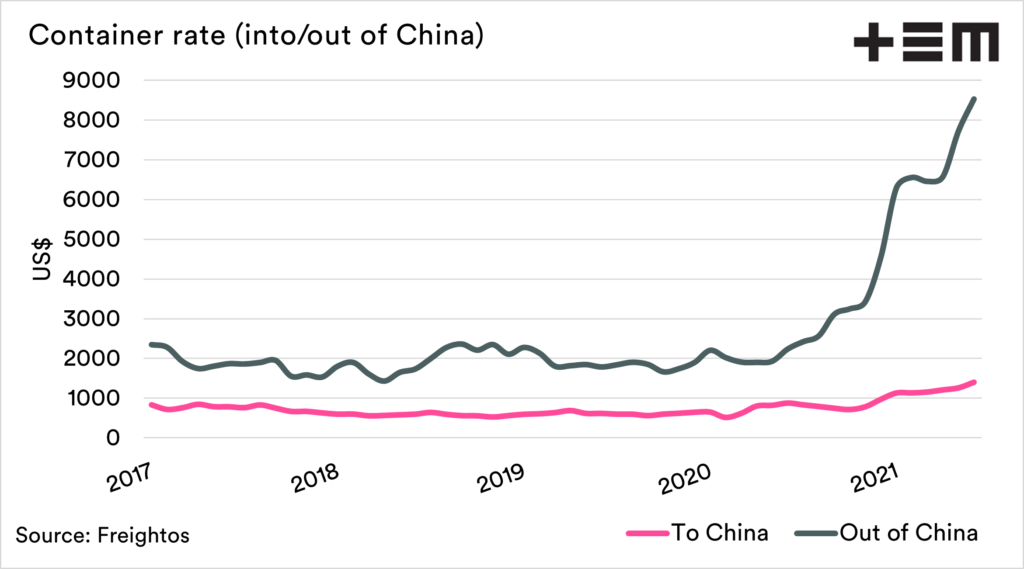
This difference between rates in different directions can be seen in the chart below. This chart looks at the combined average rates into and out of China.
So why are rates one-sided?
One of the reasons for the increase in container rates out of China is the massive increase in consumption worldwide. Everyone seems to have much more disposable income, and most of the western world isn’t able to spend that money on leisure or travel activities.
People are instead firing up their amazon accounts and ordering en masse, increasing consumer spending. This has resulted in huge volumes and gadgets and gizmos shipped out of China.
This has all occurred against a backdrop of substantial logistical challenges. The media heavily report the Ever Given blocking the Suez canal, but there have also been significant pandemic disruptions and container shortages.
While all these boxes are shipping from China, there has been less activity in the western world, meaning that there were issues getting supplies of containers in China.
At one point shipping companies were so keen to get containers back to China that the vast majority of them were landing home empty at early points of the year.
The likelihood is that these high freight rates will start to come under pressure, as the world returns back to normality. The question is when? more on that later (this articles getting a bit long!)