Market Morsel: Urea, you’ve gotta see her

Market Morsel
At EP3, we will continue to provide insights into the fertiliser market, enabling farmers and the industry to close the information asymmetry.
An information asymmetry occurs when one side of a transaction possesses greater knowledge and information than the other party. This generally occurs when a good or service seller possesses greater knowledge than the buyer.
Many farmers in the country still haven’t received the urea they require, and in many cases, it is too little too late, with dryness starting to prevail.
In the rest of this article, we will look at the most recent import data and where the pricing lies.
The import data
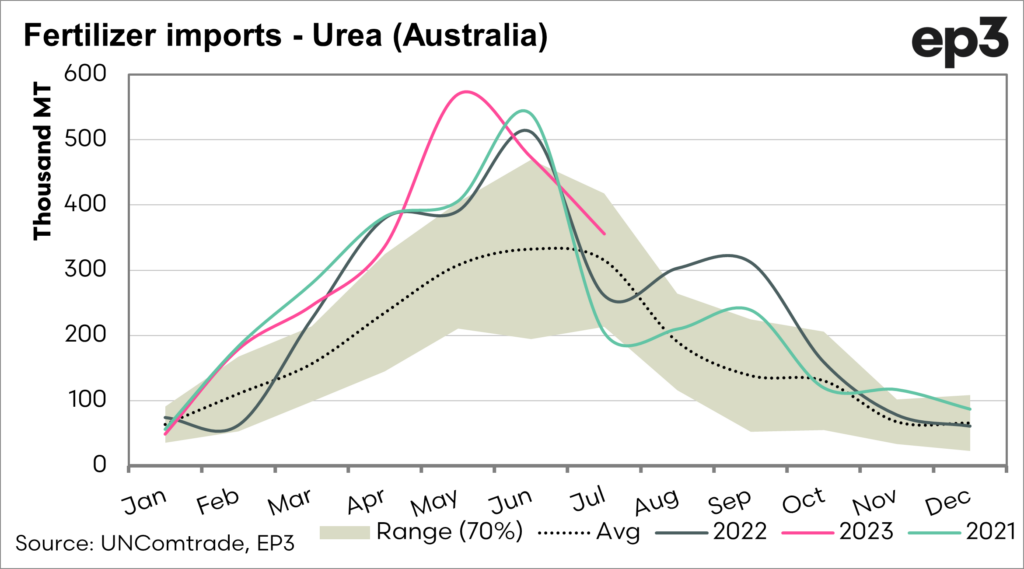
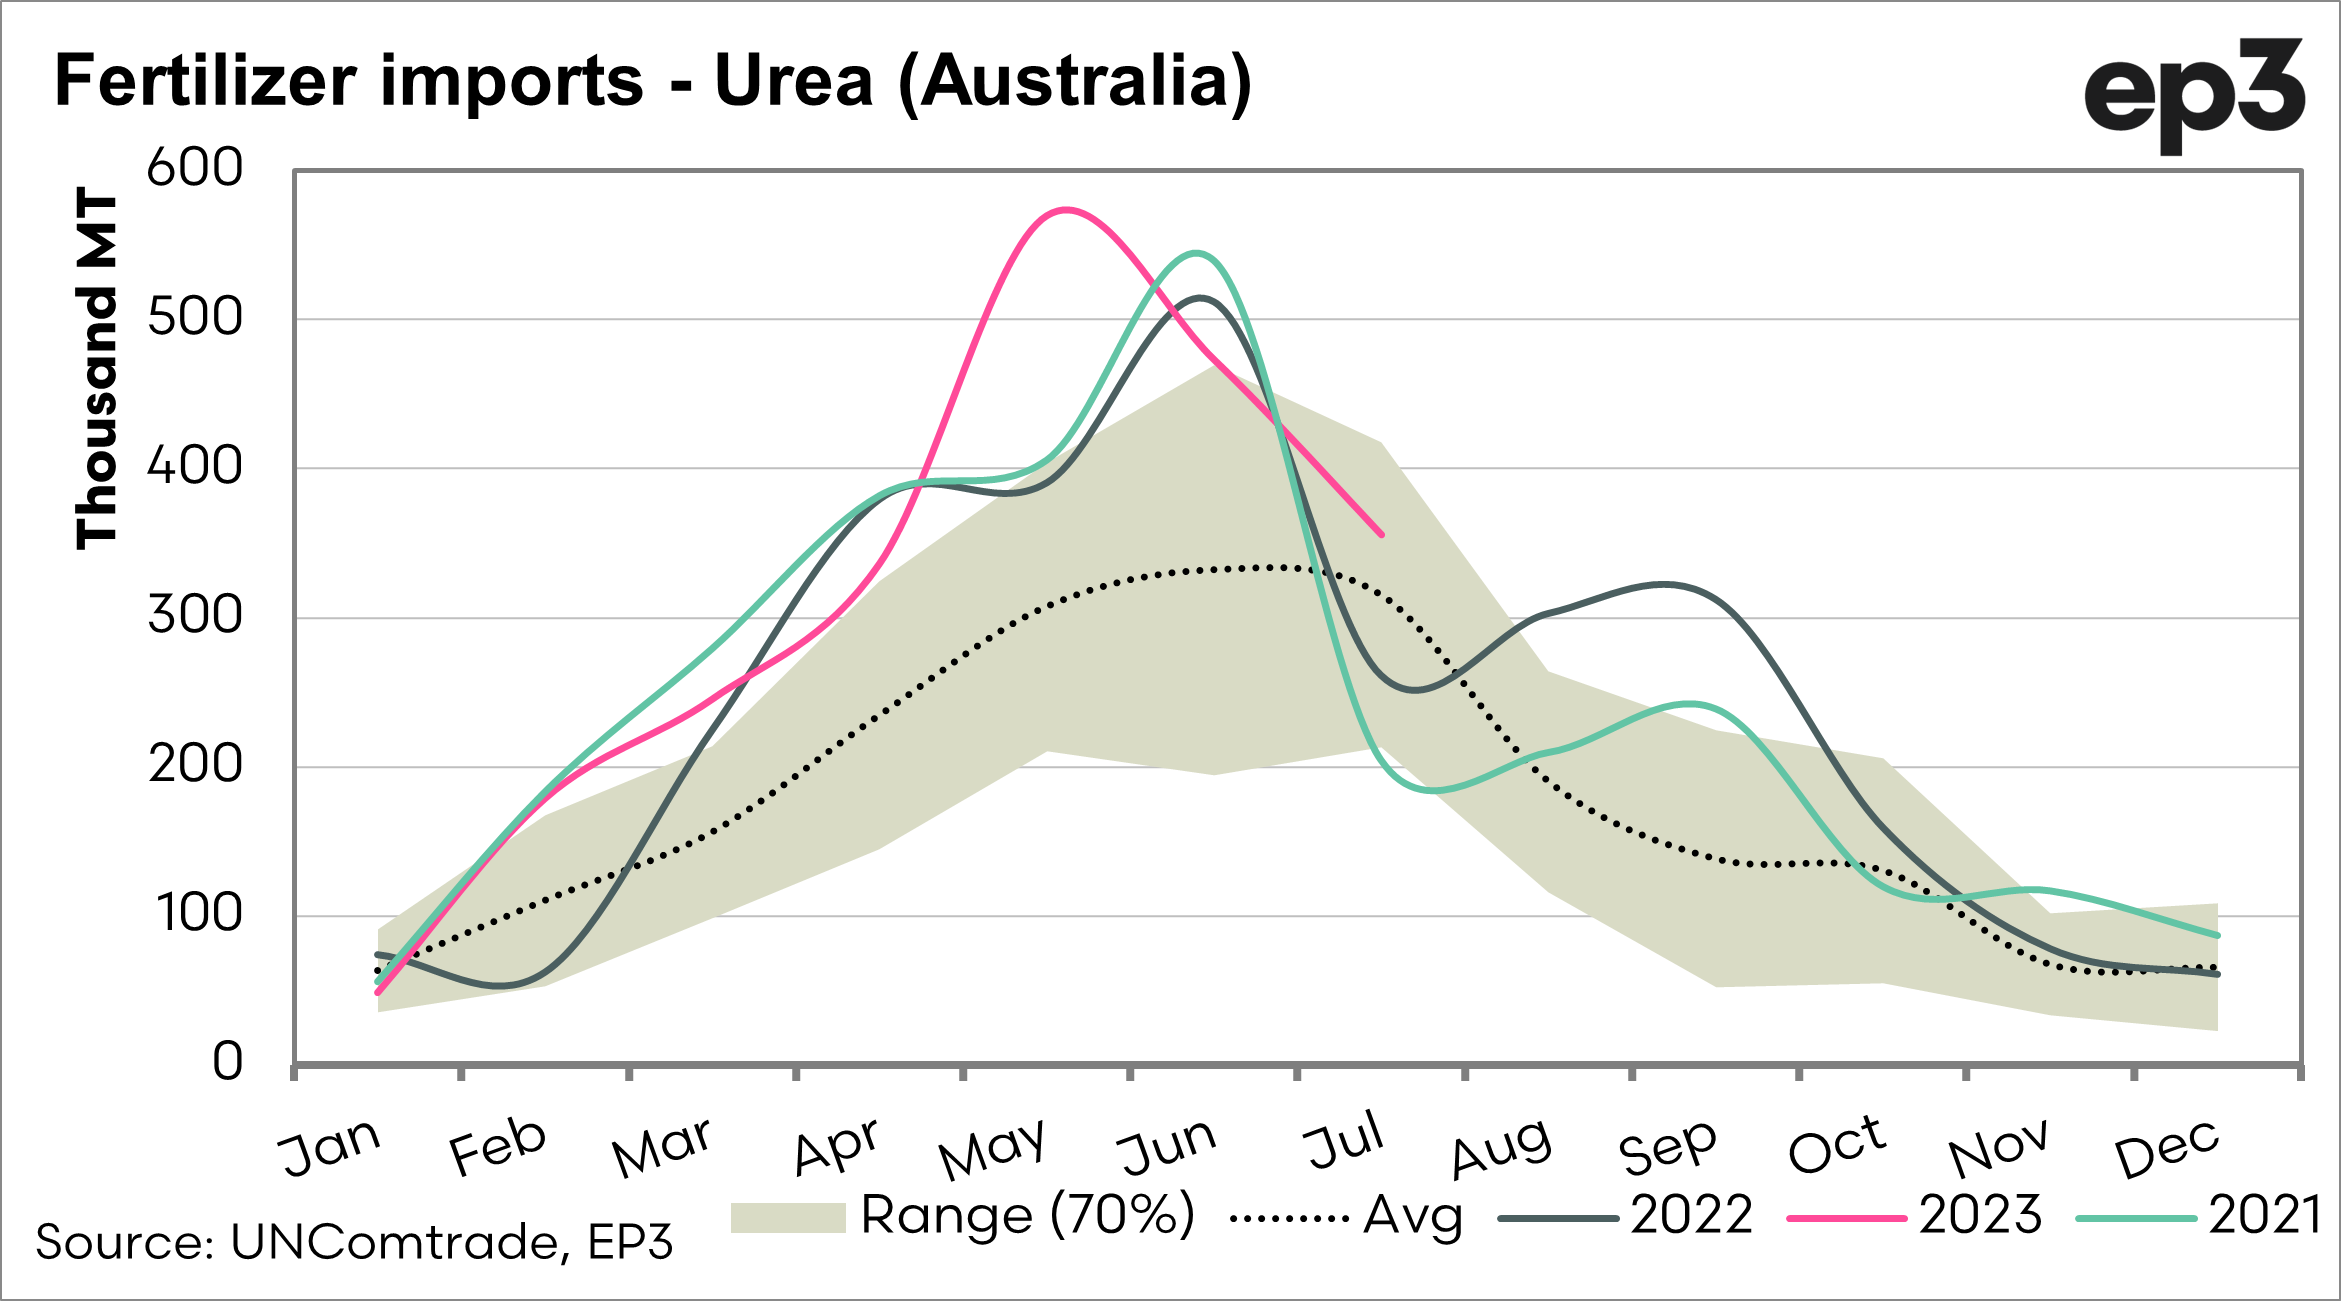
In July, 350kmt of urea was imported. Let’s see how that stacks up.
The first chart below shows the seasonality of urea imports into Australia. Typically, the seasonal peak of imports would be during June. This year, the peak was in May, when Australia imported record volumes of urea. Subsequent months have experienced continued strong imports.
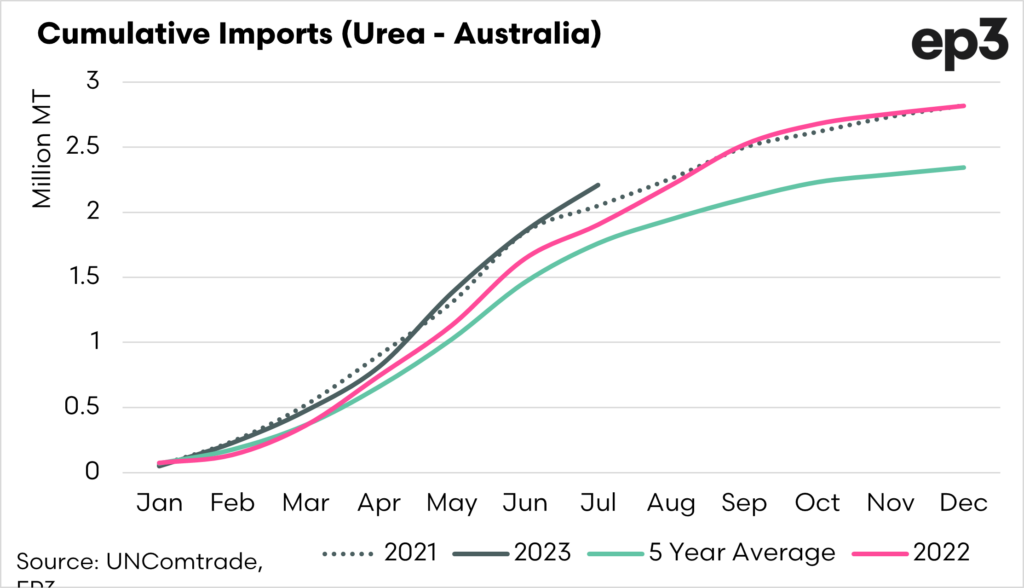
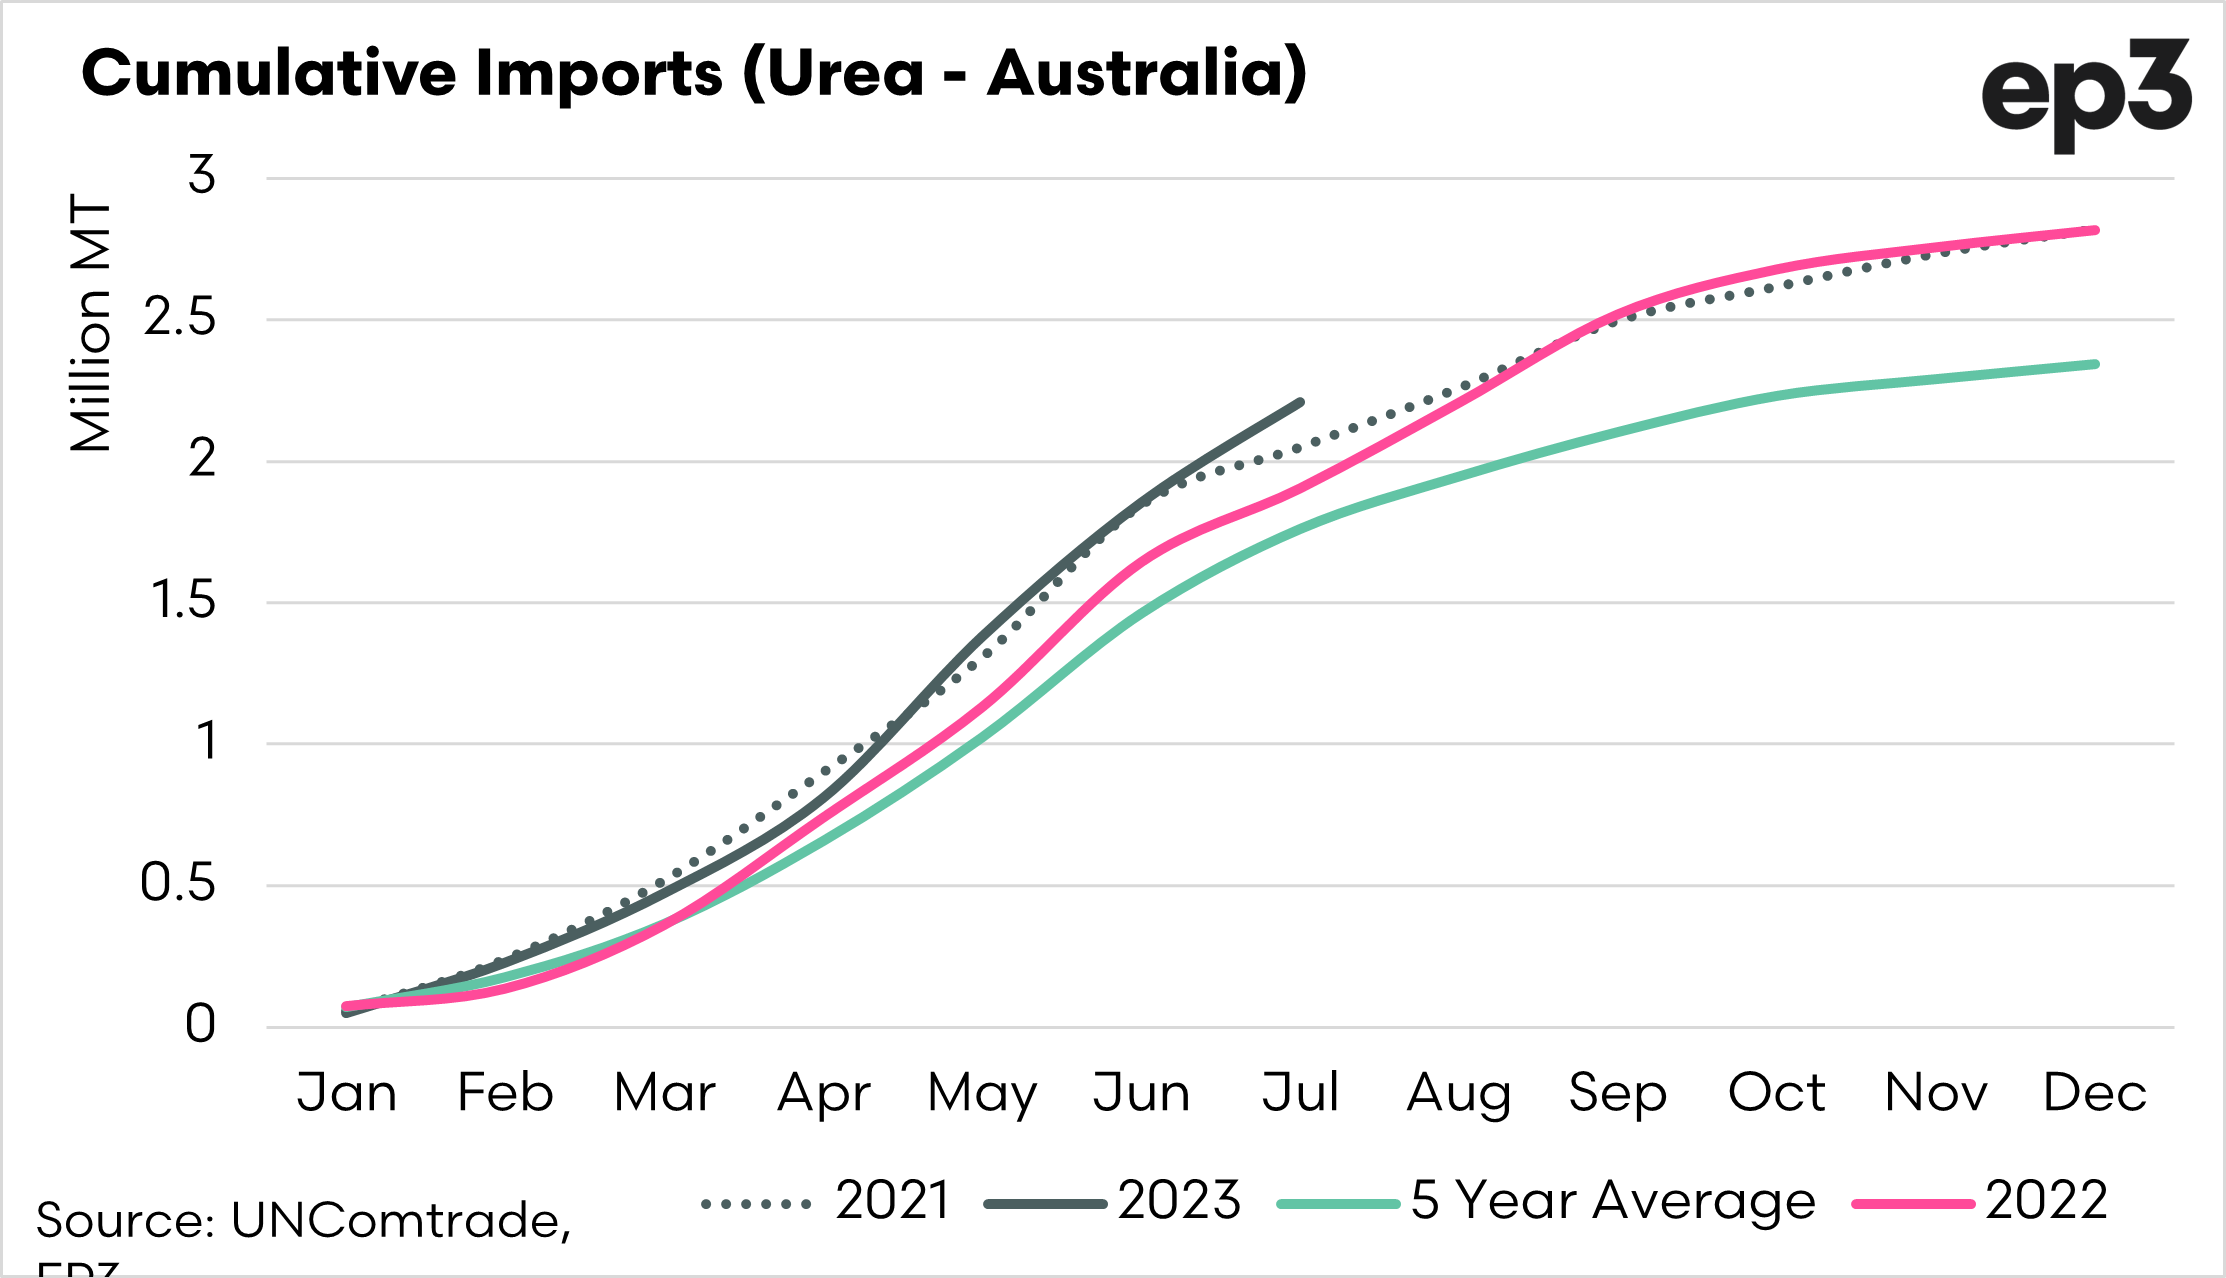
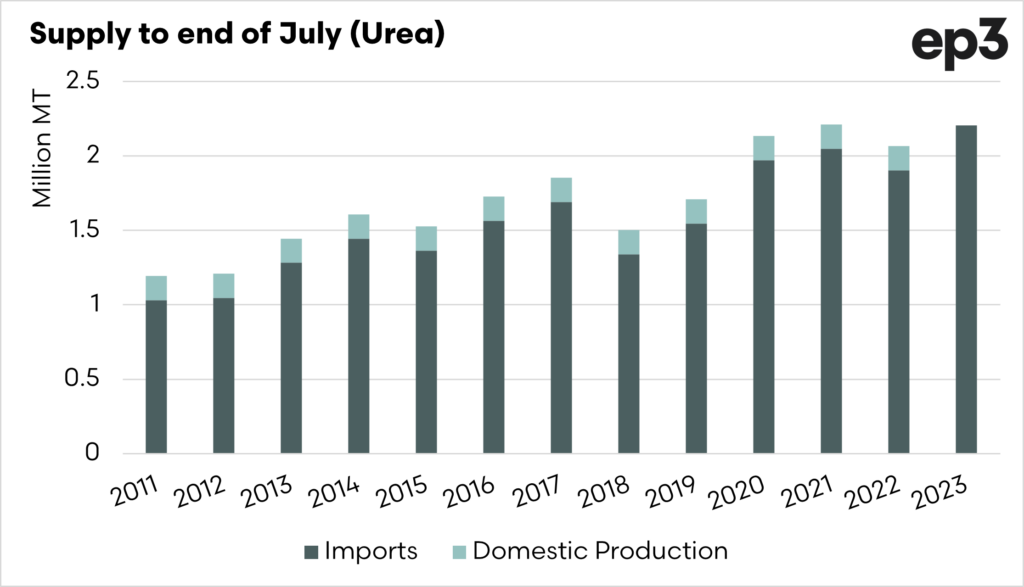
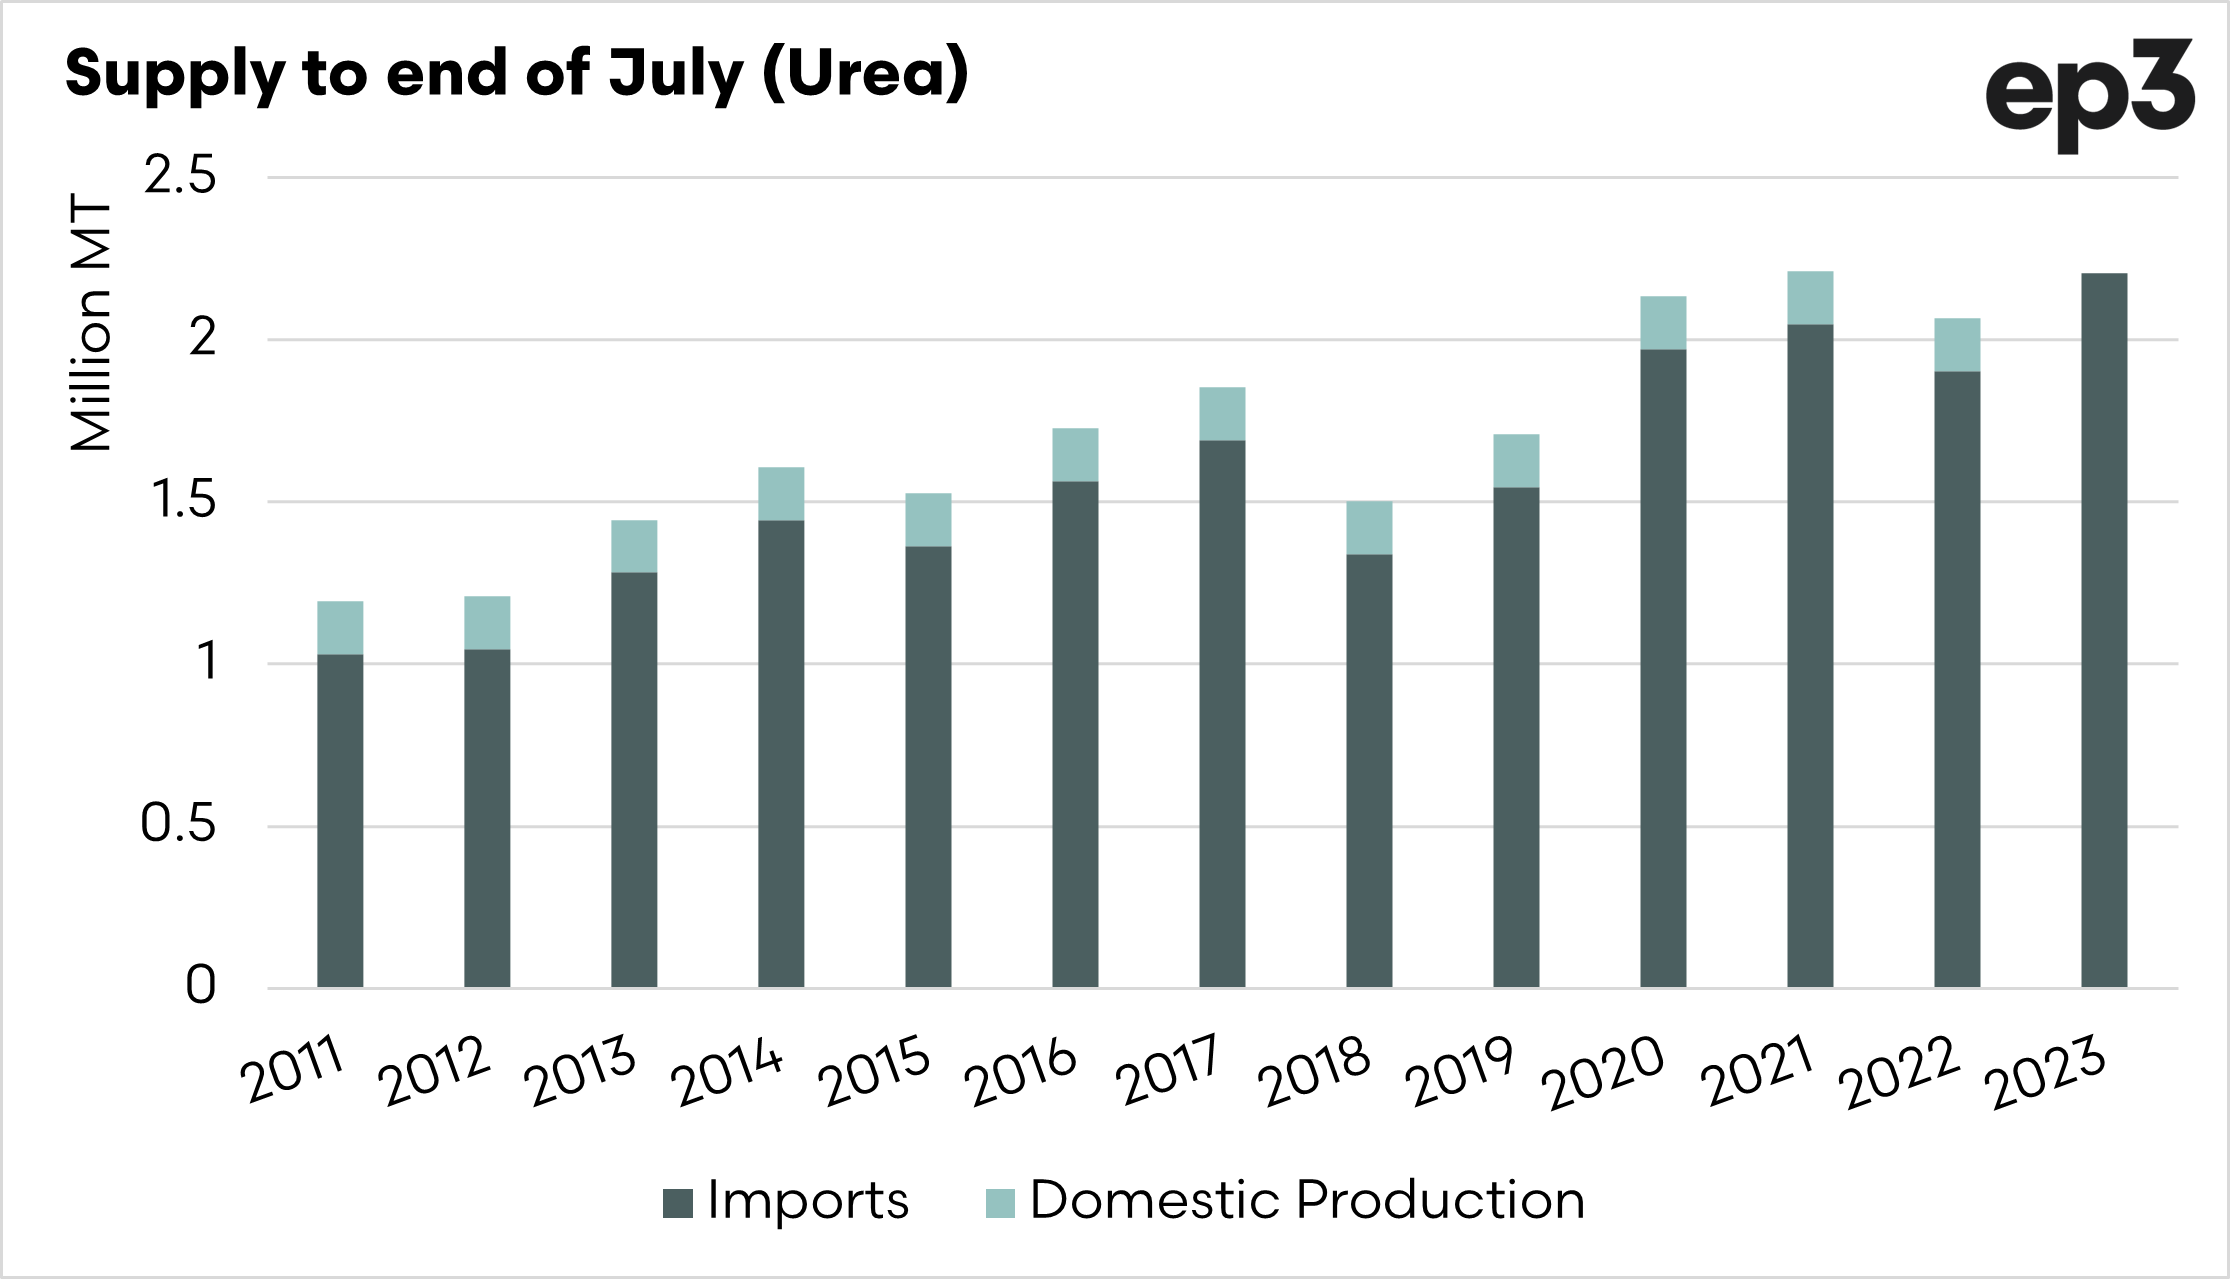
The cumulative volume of imports is what is most important. So far, to the end of July, Australia has imported 2.2mmt of urea. This is a record volume of imports for the year’s first seven months.
It is important to note that the Gibson Island facility no longer produces urea domestically, so in chart 3, I have included a rudimentary calculation to show a theoretical total supply of urea. This chart shows that the total supply is slightly higher than the record year in 2021. The calculated domestic supply doesn’t take into account any urea which Gibson Island exported.
So this year, we are seeing supply issues, but at the same time, the data shows the imports are record high, and supply is high even with the absence of Gibson Island. It makes for an interesting conundrum.
And at what price?
Last month, I discussed our urea import pricing model (see here). At EP3, we developed the import pricing model to provide insight into the trend of urea pricing in Australia in the absence of publicly available urea pricing information.
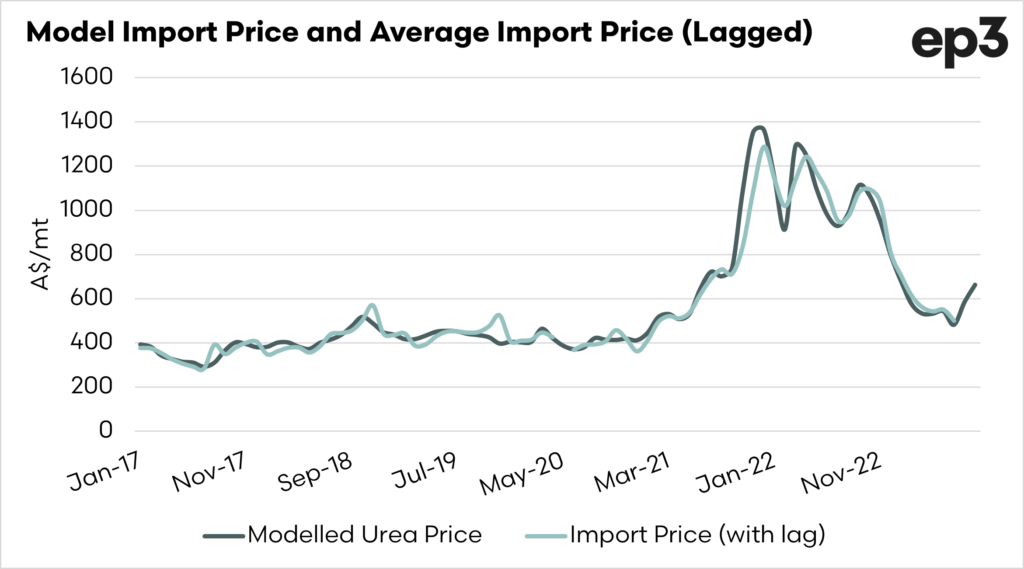
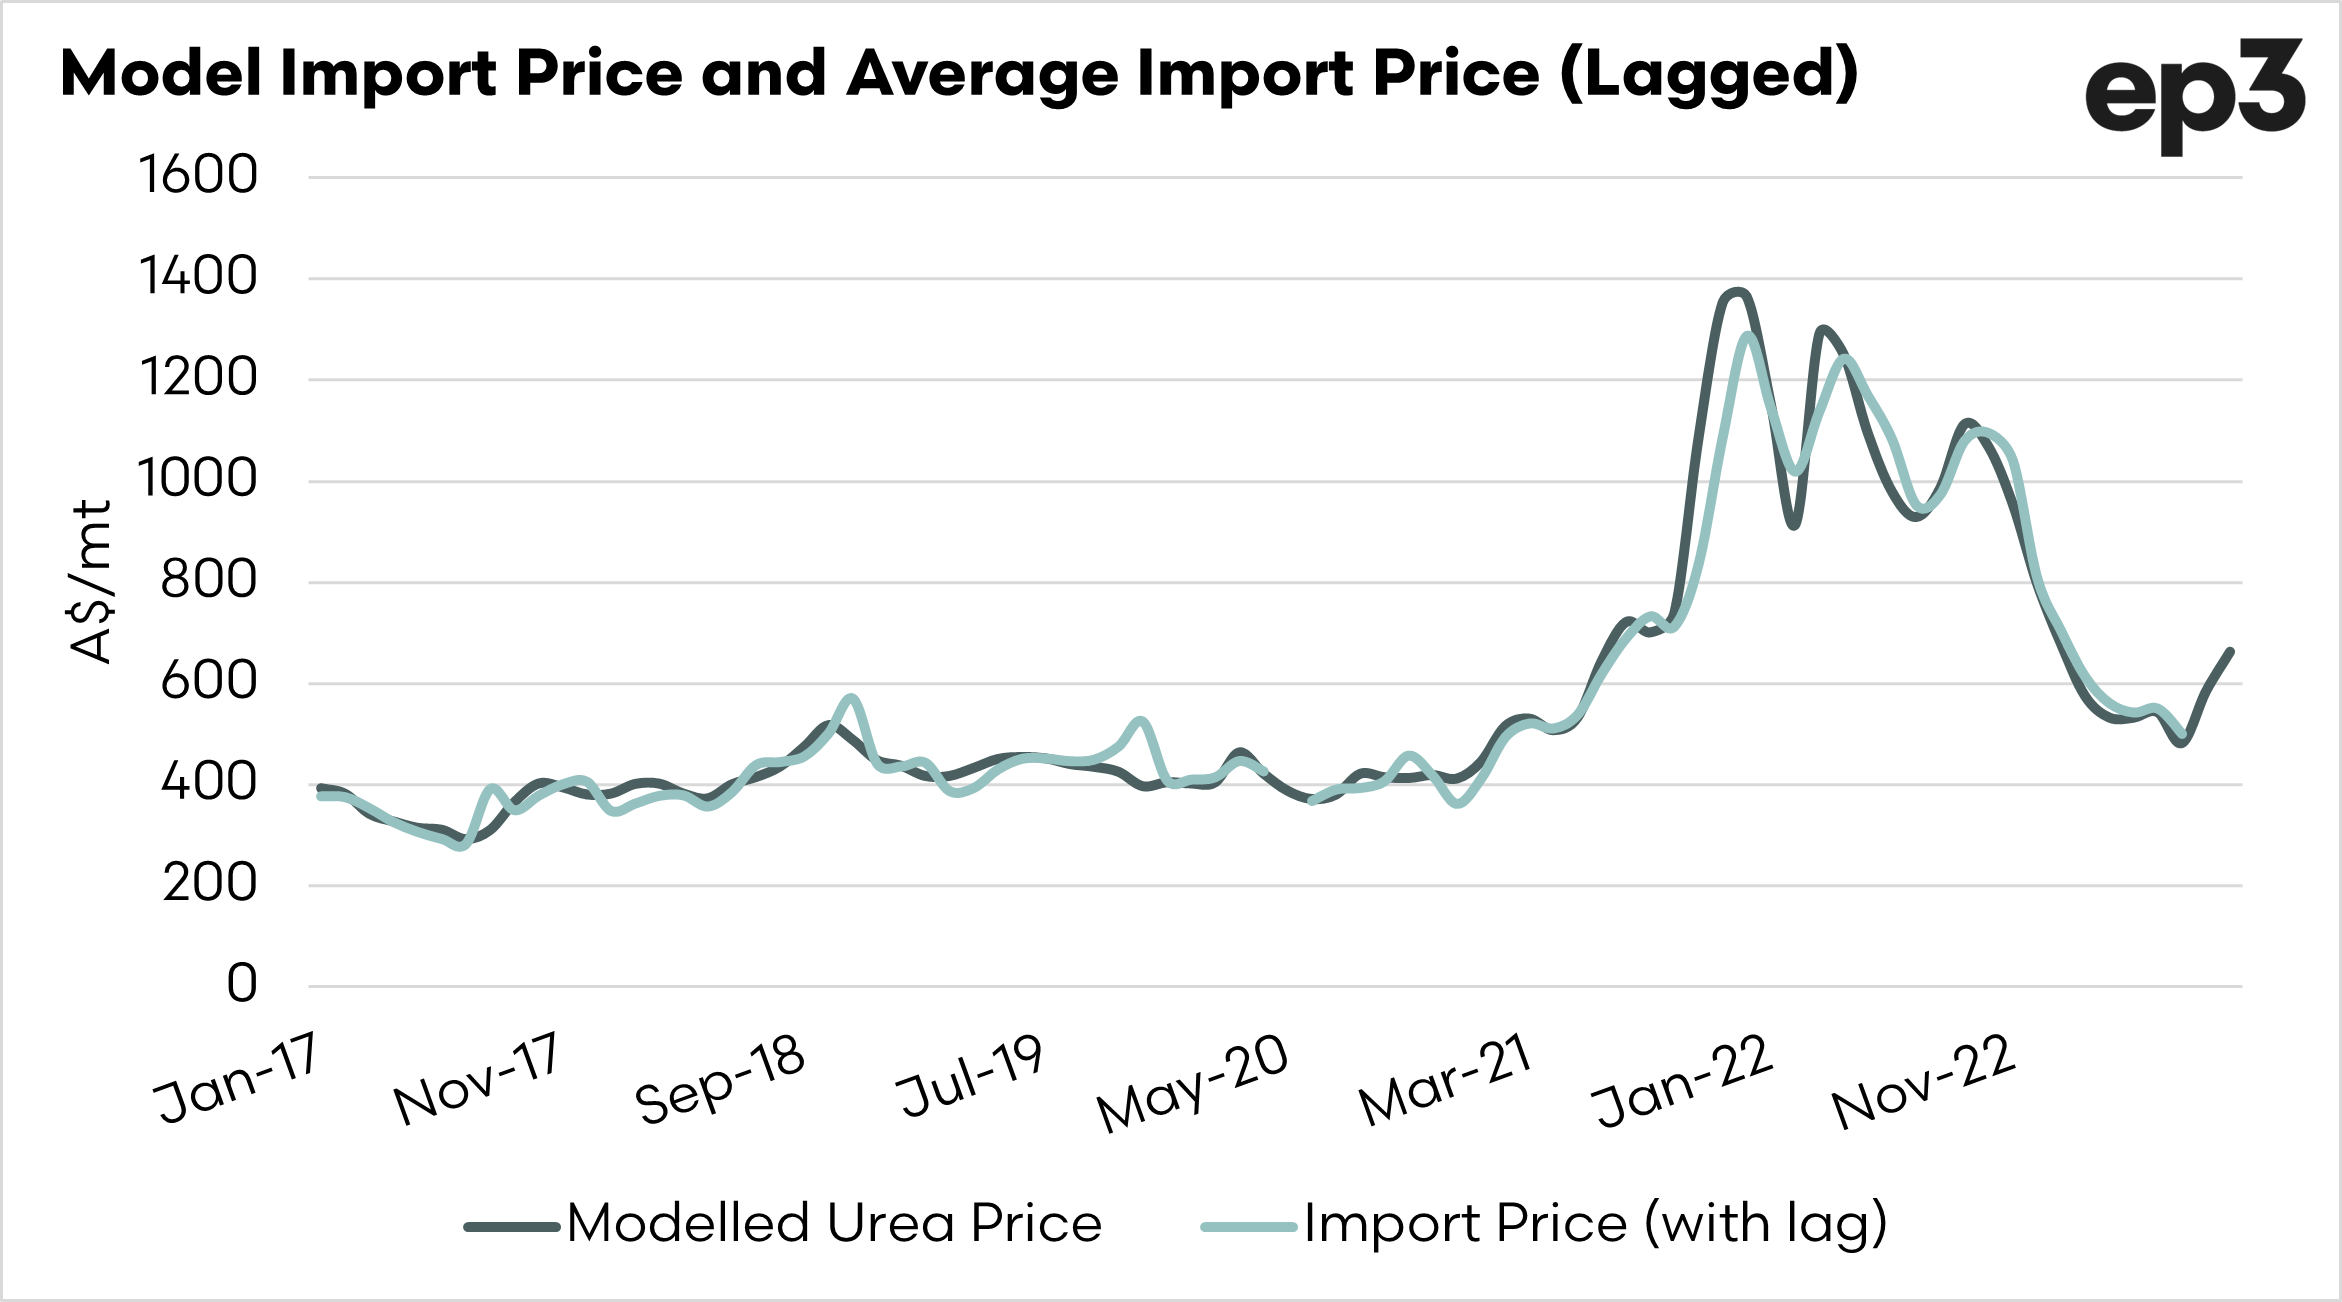
We now compare the price we have modelled against the actual import price of urea in Australia. A lag effect is added to the import price data, and when we do this, we can see that the modelled price follows very closely.
The correlation is between 0.91 and 0.98, dependent upon the lag used. A perfect correlation is 1.
The chart below uses a one-month lag e.g. the price we modelled in June is against the actual import price in July. Based on the data, we theorise that there is a 1-2 month lead between our model and the actual import price in Australia. So, the price we model for July will be close to the import price for August/September.
It is important to note that the modelled import price for August/September has risen substantially since June/July.
NB- When we say import price, this is not the price you receive as it does not include financing, on land logistics or importer/reseller margins. It is merely to provide a trend.

