
Shining a light on Australian fertiliser pricing.

The Census
Earlier this month, we put the call out for Australian farmers to help us provide some insights into the Australian fertiliser market.
If you would like to contribute to the census, you can find out more about it by clicking here
The census received some feedback all generally positive. This feedback also included an explanation about why fertiliser prices can’t be transparent from a fertiliser industry representative.
The reason that a spot price for fertiliser not being publicly available information is that one importer may have a different cost base from another. For example, they may have purchased the fertiliser on a different day.
In my view, this is irrelevant. The market works on whoever has the best price; as a buyer of fertiliser, it is irrelevant what the cost of procurement is.
If seller A is at A$1100 and seller B is at A$1200. Tough news, Seller B, but the farmer doesn’t care what your cost base was. That’s trading! Either you will drop to meet the market, or seller A will increase to capture more margin.
The buyer of grain doesn’t care whether you have high input prices; they will pay what the market is. No more than that. This is how markets operate and why traders hedge against adverse movements in price.
Insights
Please bear in mind that these insights are initial. Whilst we have had a strong response so far from producers supportive of this initiative, we need to continue to get quotes through to increase the strength of this analysis.
In this analysis, I have only looked at quotes over the period Mid-September to Mid-October.
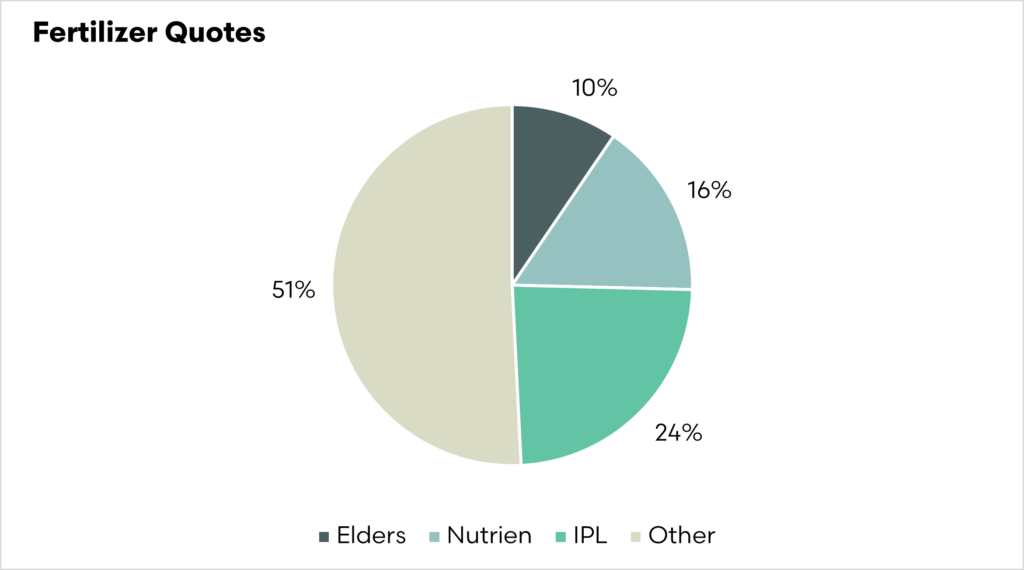
One of the least surprising data points is who the quotes are from. The most significant volume of quotes is coming from Incitec Pivot, followed by Elders and Nutrien. This makes sense as they are the most prominent individual players in the marketplace; they make up 49% of all the data received. The remainder is made up of a large number of operations with a low number of quotes.
One of the insights we would like to provide is the variability of pricing within and between states.
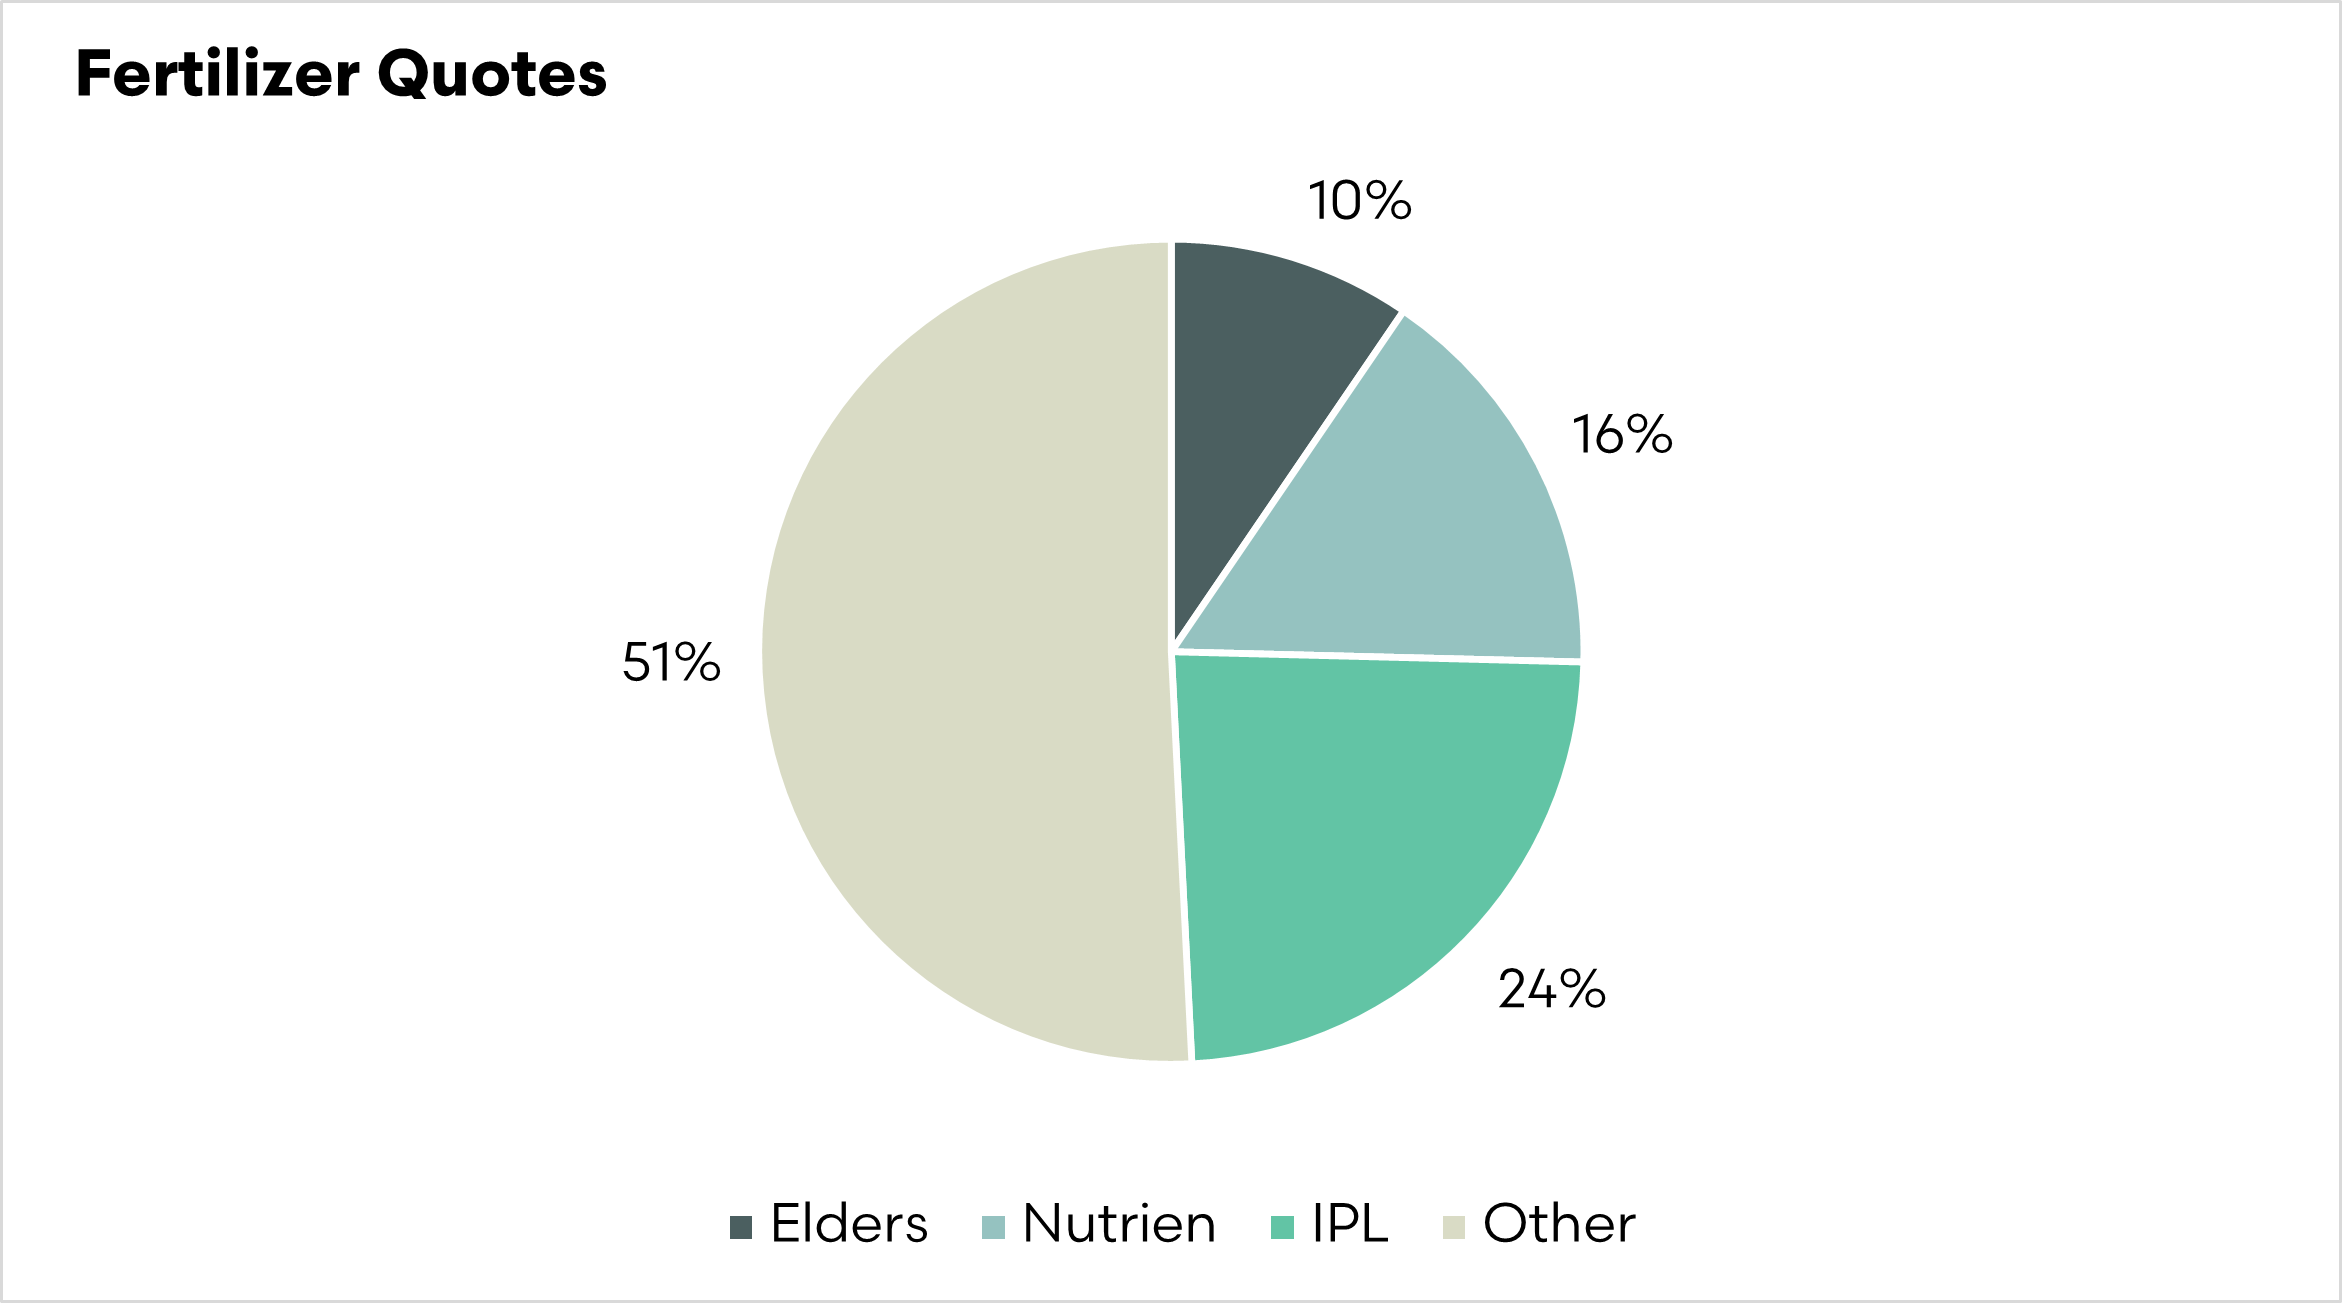
As an initial analysis, the variability of pricing for urea (ex port) is displayed for South Australia, Victoria and Western Australia. These are the states in which we have received the largest input from farmers.
We can see that the difference between the high and low quotes in South Australia and Western Australia is quite similar at around A$60-65/mt. The difference is much higher in Victoria at A$155 for the period.
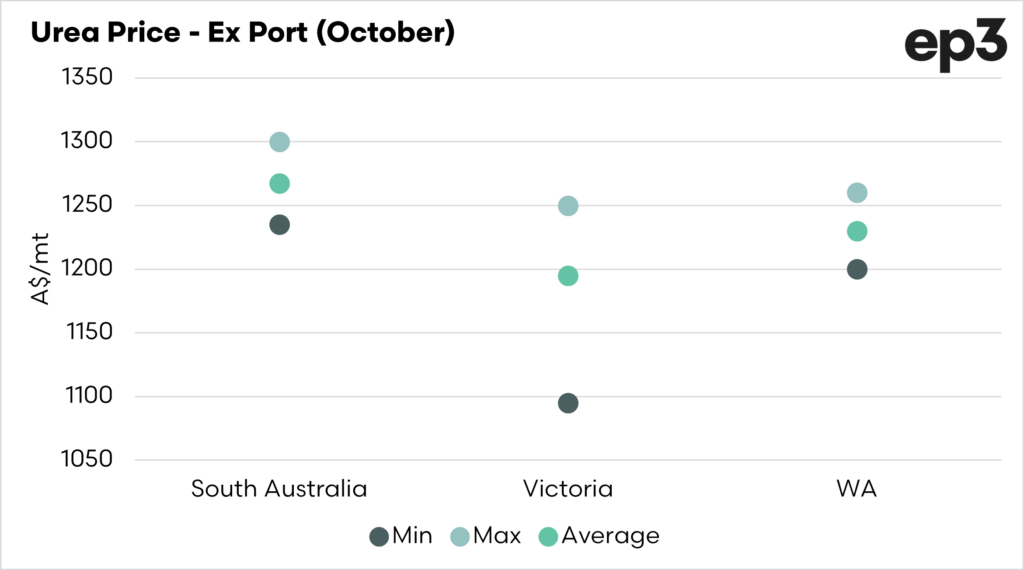

Let’s look at how it compares to our ‘Landed Model’. Our landed model or cost and freight model represents the theoretical cost of purchasing urea in the middle east (our largest supplier), freight to Australia and discharge.
It is not a perfect model, but it is there to give an indicative value of the replacement cost.
The chart below shows the average price for each of the three regions selected vs the CFR price. It is expected that this value will be lower, as there are costs that have to be added to this (retailing, admin, finance, margins etc).
The difference between the CFR and local price is pretty consistent at around 15-17% across all states.
The insights so far have shown that there is an element of consistency across much of the supply chain, with some variability between states.

We still need you!
The more input that we get from farmers, the better the insights we can provide. It is reliant on you. Transparency in pricing is important for markets.
If you can help provide us with data in an anonymous fashion, click here.