The emperor’s new clothes

The Snapshot
- Wool and cotton imports in China dropped dramatically during the first four months of 2020.
- They have both recovered. Cotton to very high levels, wool not so.
- Cotton imports year on year are up 64%, but wool is only up 22%.
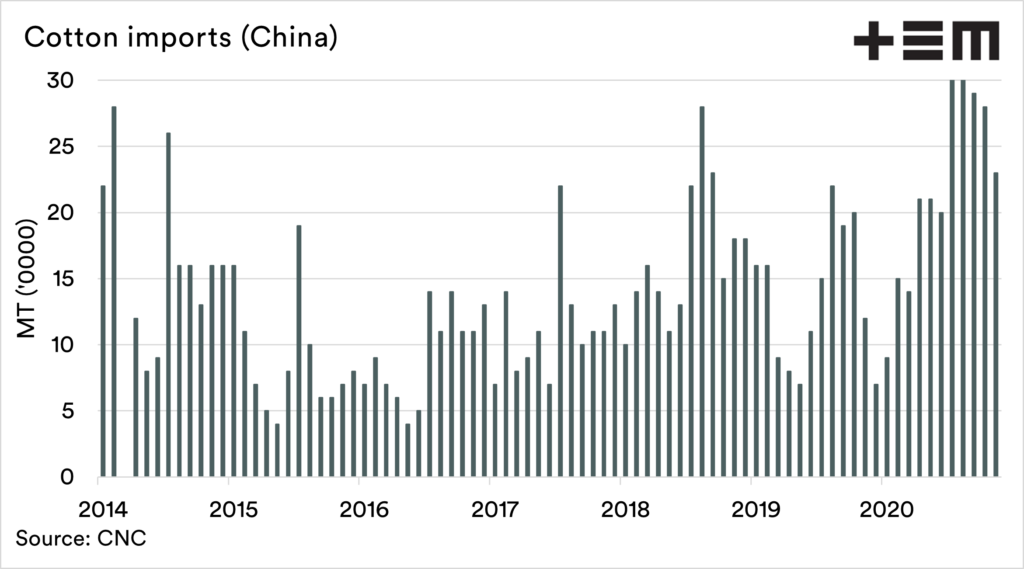
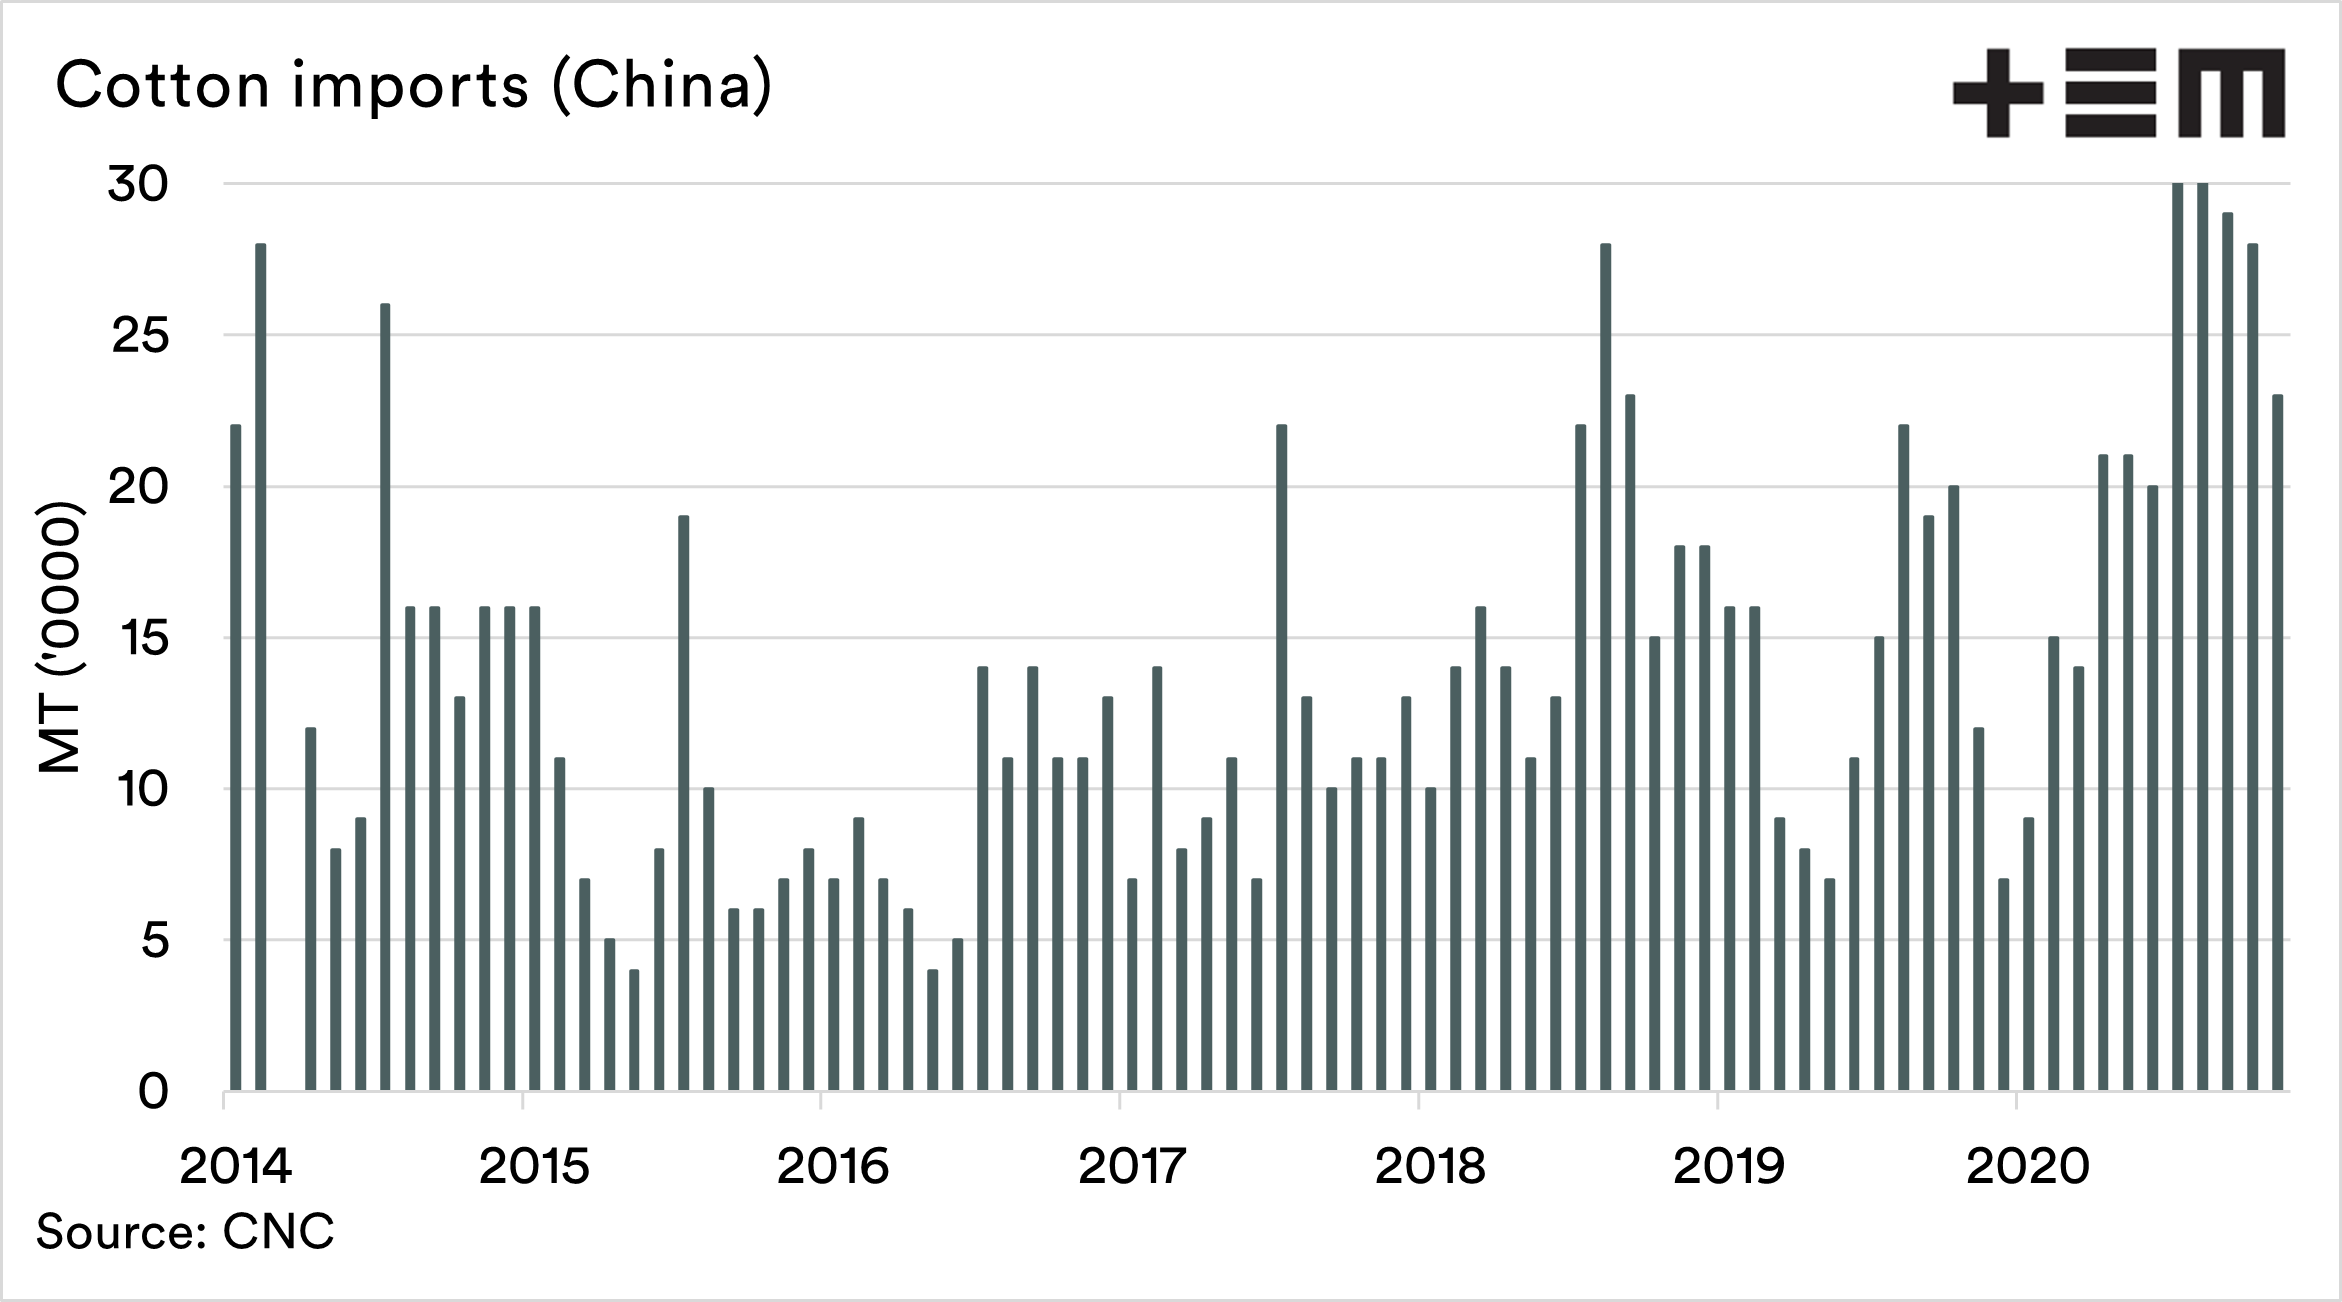
- Cotton imports to China have been growing strongly in recent years, whereas wool has declined.
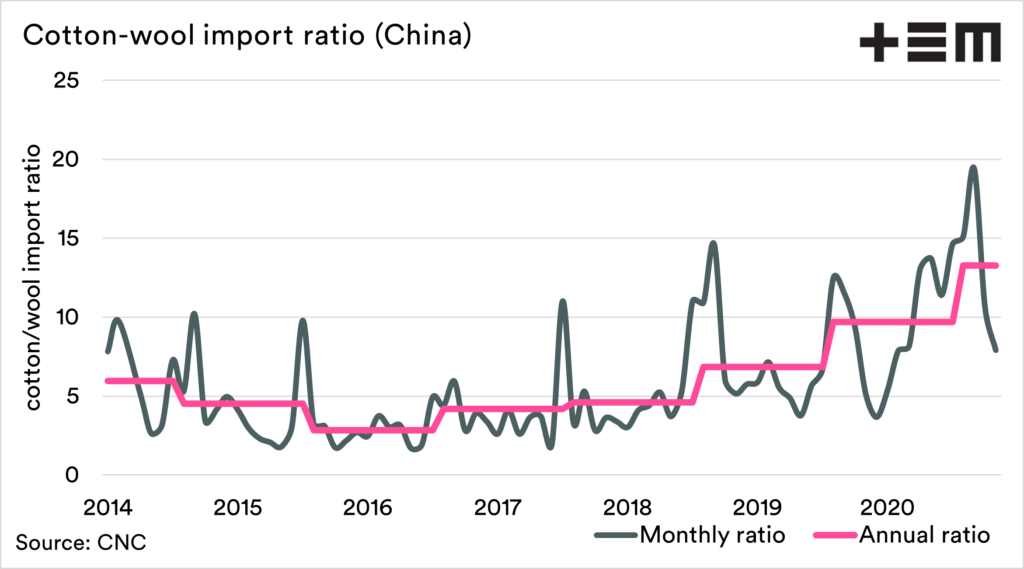
- In 2016 China imported 2.82mt of cotton for every mt of wool. In 2021 this ratio has risen to 13.26mt of cotton for every mt of wool.
- Covid was a factor last year; however, wool imports in China (our biggest partner) were reducing prior.
The Detail
The headlines are all about the huge imports of grains and meat into China. There is another set of commodities that China is hurriedly importing – and that is fibres.
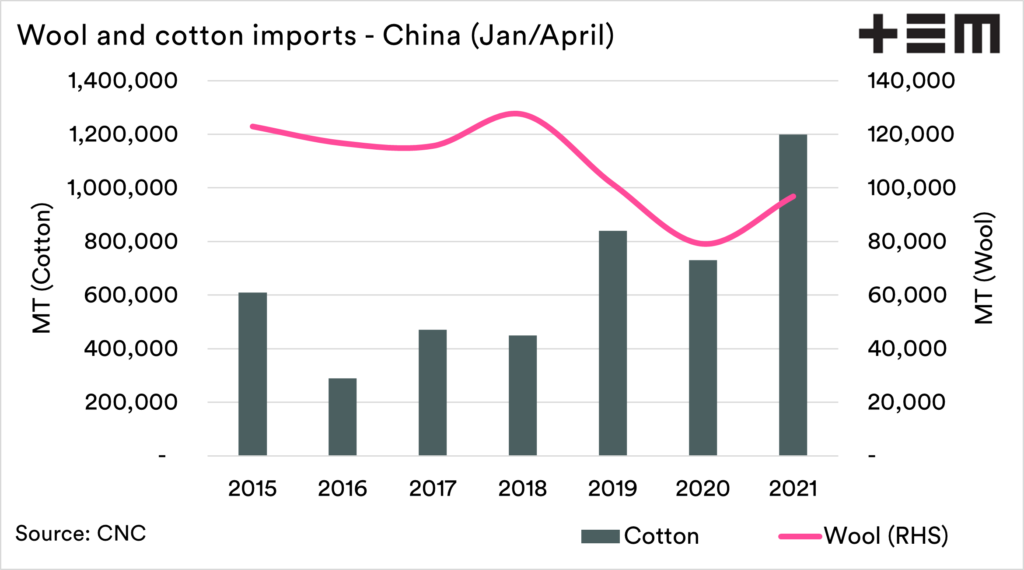
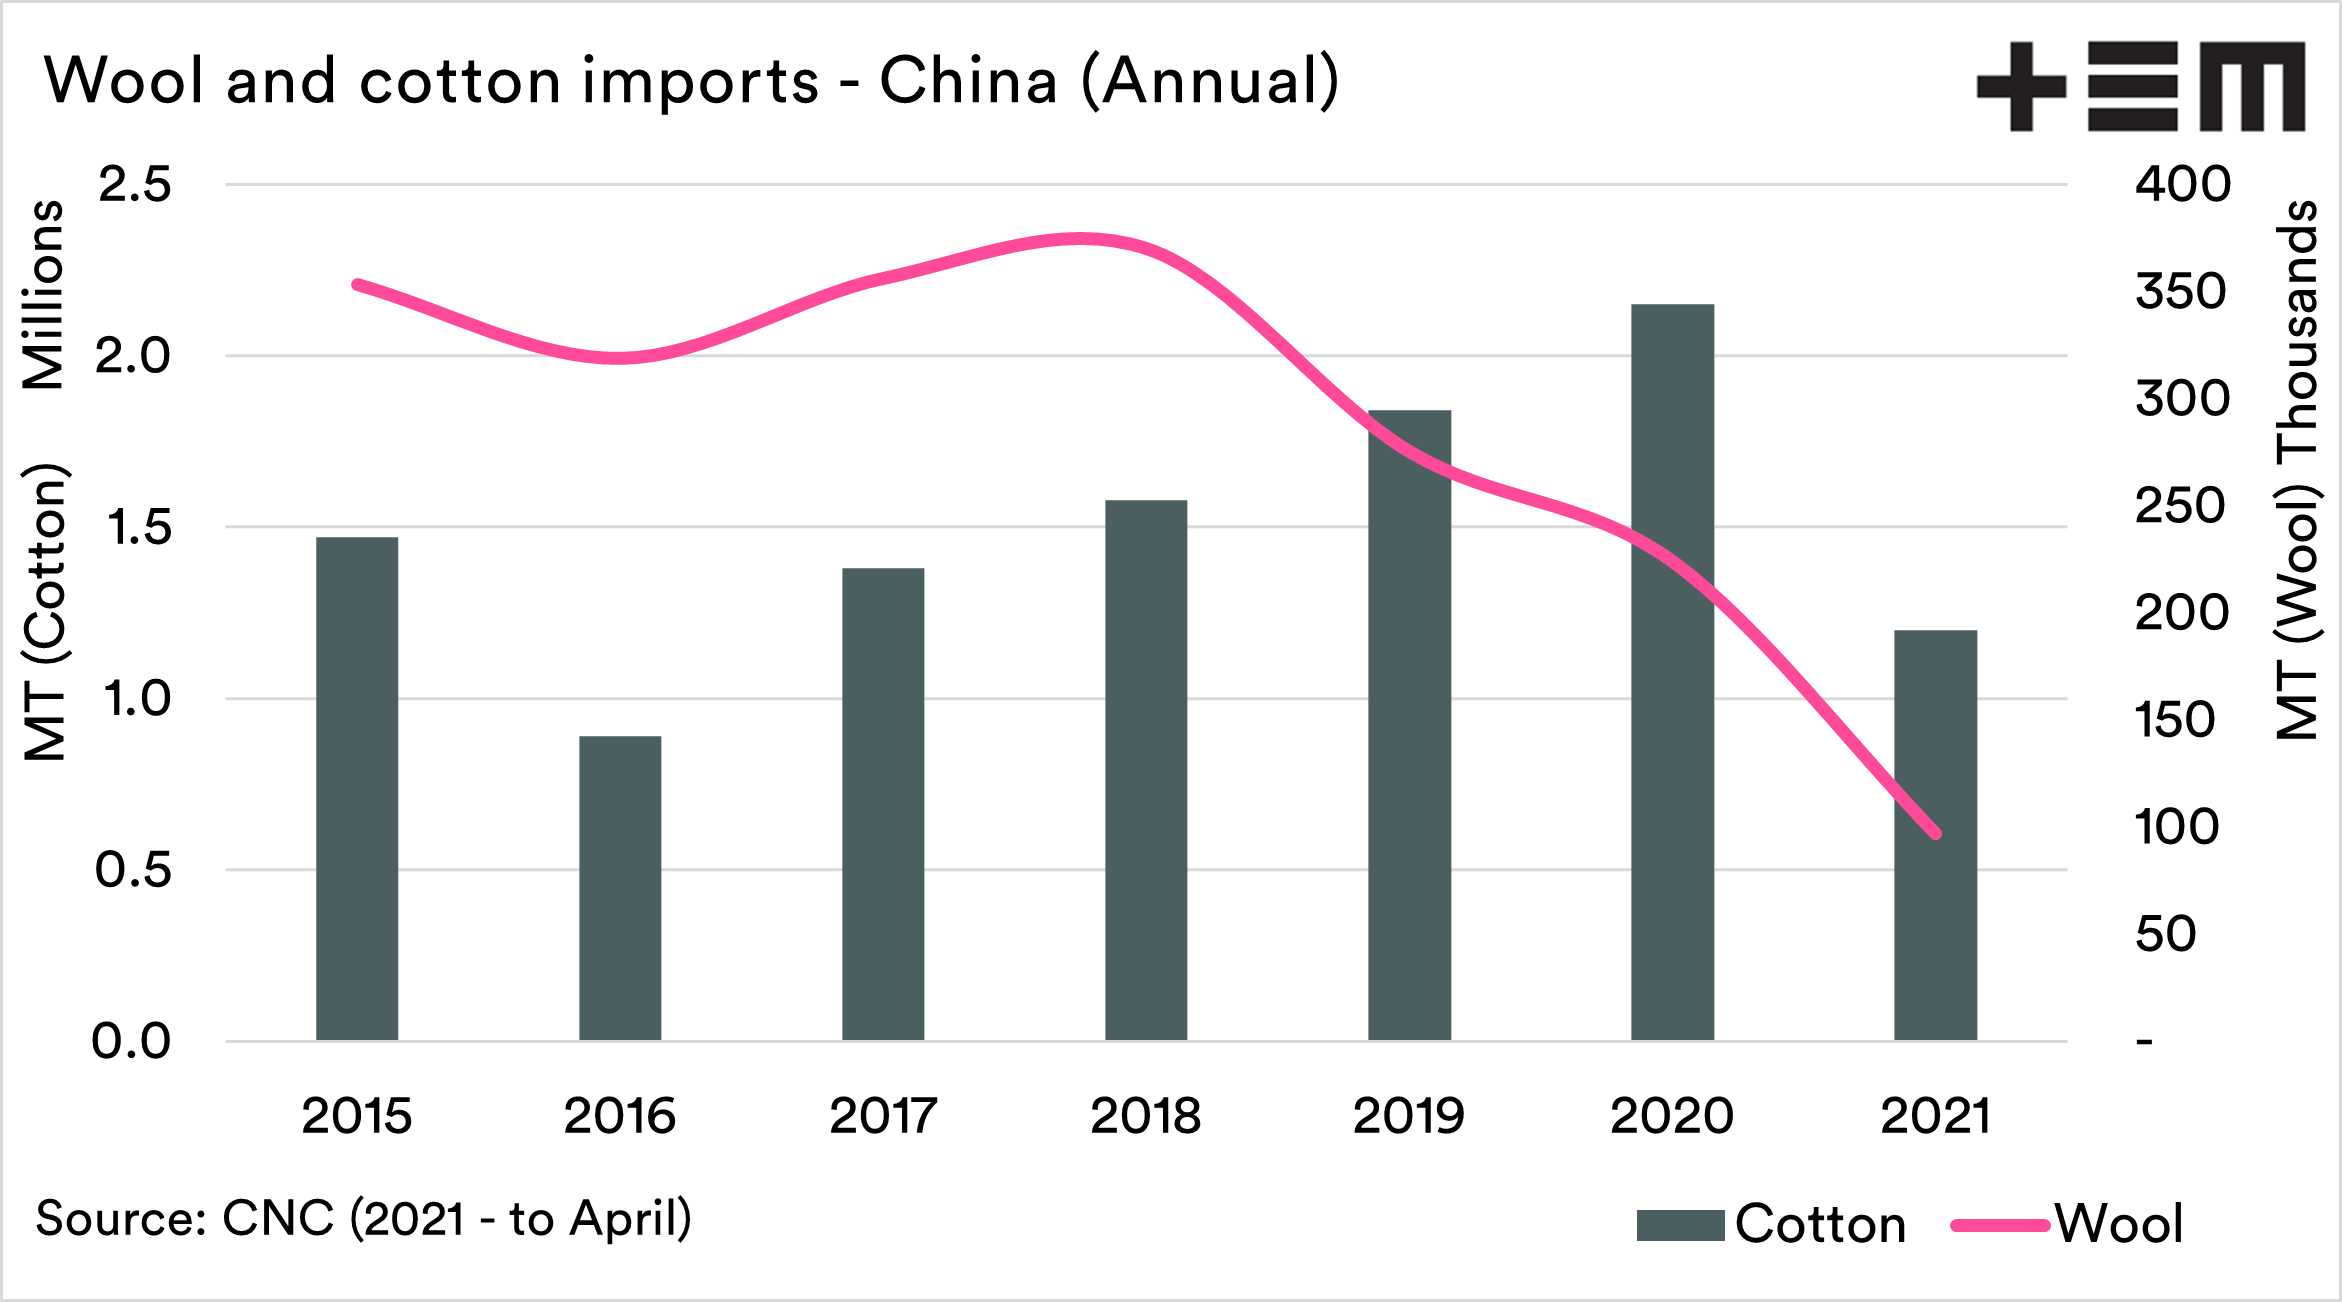
The first chart below shows the total import volume for Jan – April for each year since 2015. Up until the end of April, they have imported 1.2mmt, versus a previous high for this period of 840kmt back in 2019.
To put how high these imports are, it is higher than the import volume for the entire calendar year of 2016. It is highly likely that by July, we will see imports exceed 2017 & 2018 full-year totals.
Last year saw imports for the first four months of the year decline substantially due to COVID-19. The fall was substantially sharper than that experienced by cotton. There is some logic to this, as the fears were of poor economic conditions.
Wool is favoured during a strong economy. We covered this in our analysis of the relationship between copper and wool (see I CU wool).
Whilst cotton has surged well ahead, wool hasn’t been as strong. Cotton increased by 64% year on year, whilst wool only gained 22%.
2021 has seen the lowest imports of wool into China since 2015, except for last year.
The chart above shows the ratio of cotton imports to wool. A ratio of 20 would mean that 20mt of cotton was being imported for every 1mt of wool.
This ratio is increased every year since 2016, which means that more and more cotton imports are occurring compared to wool.
However, the reality is that the reducing volumes of wool into China were occurring in advance of COVID-19.
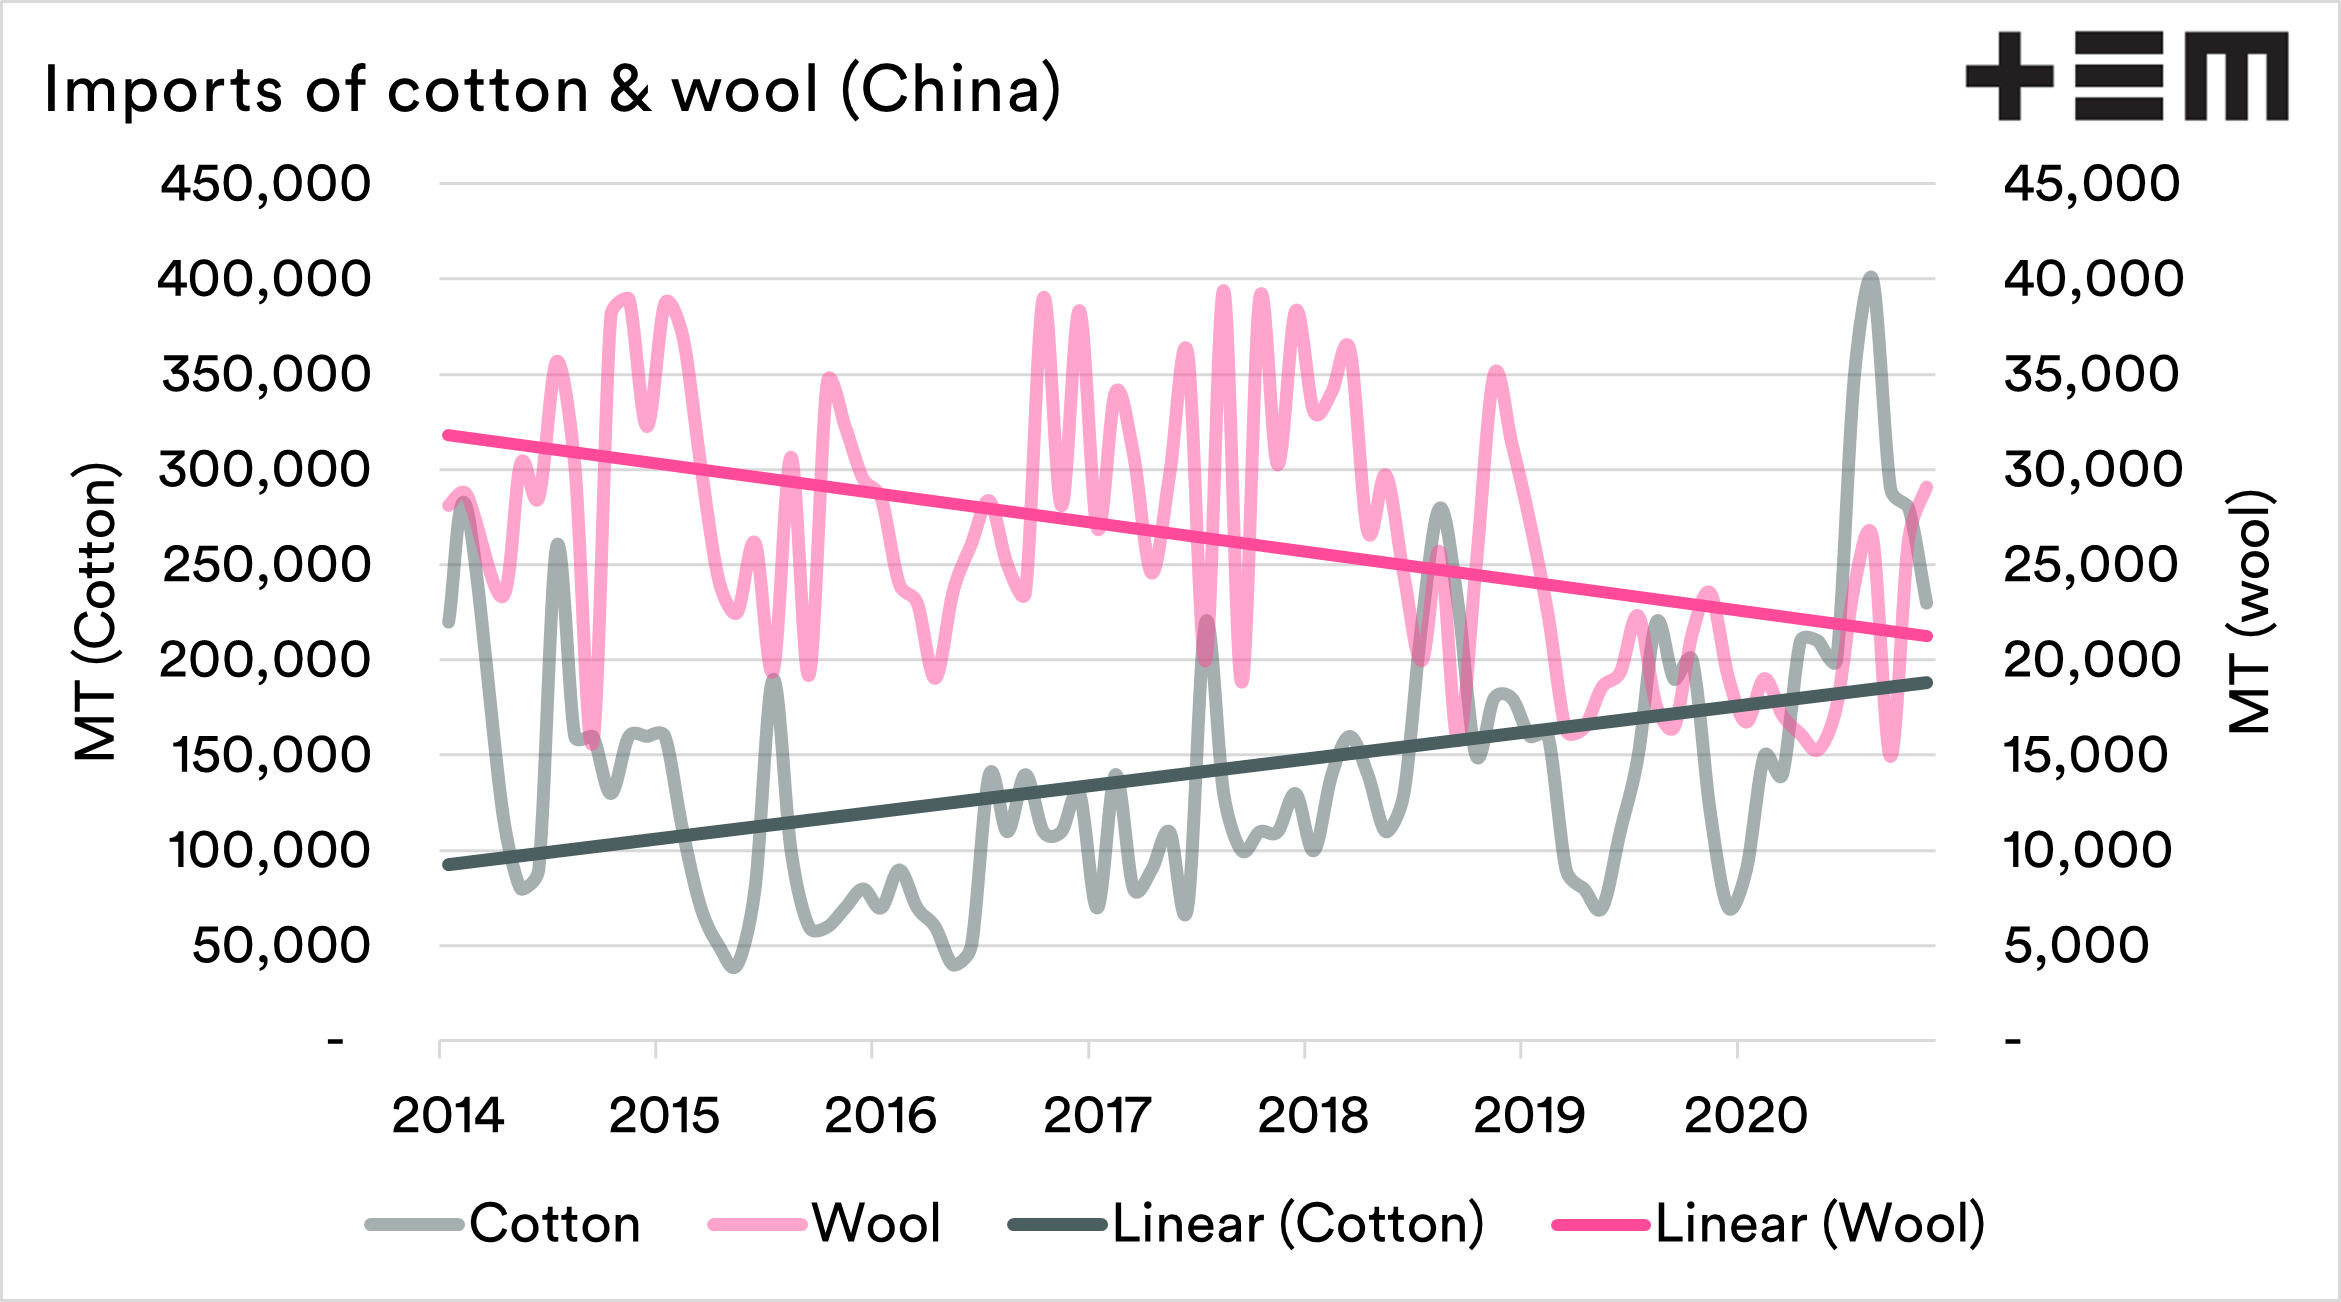
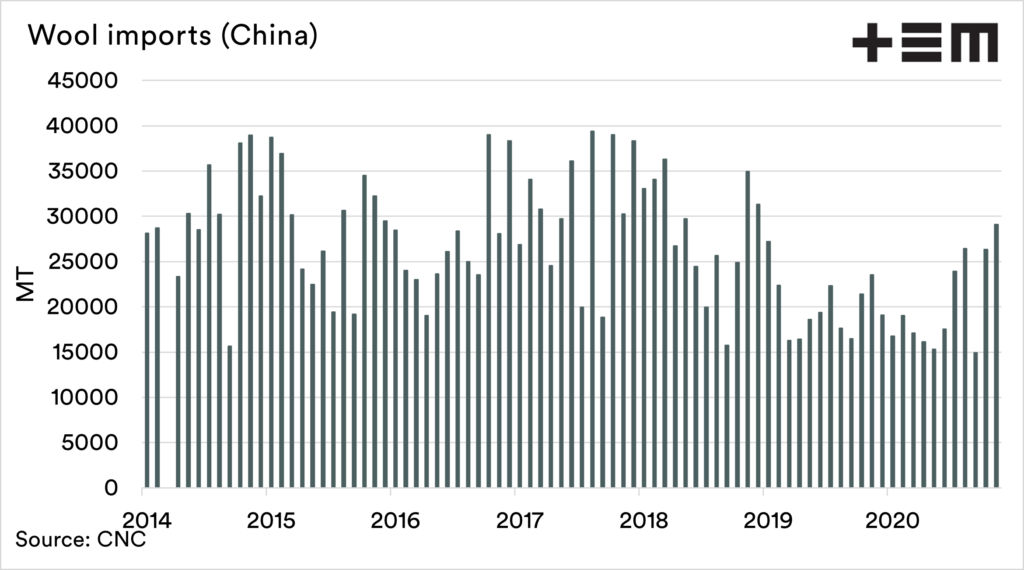
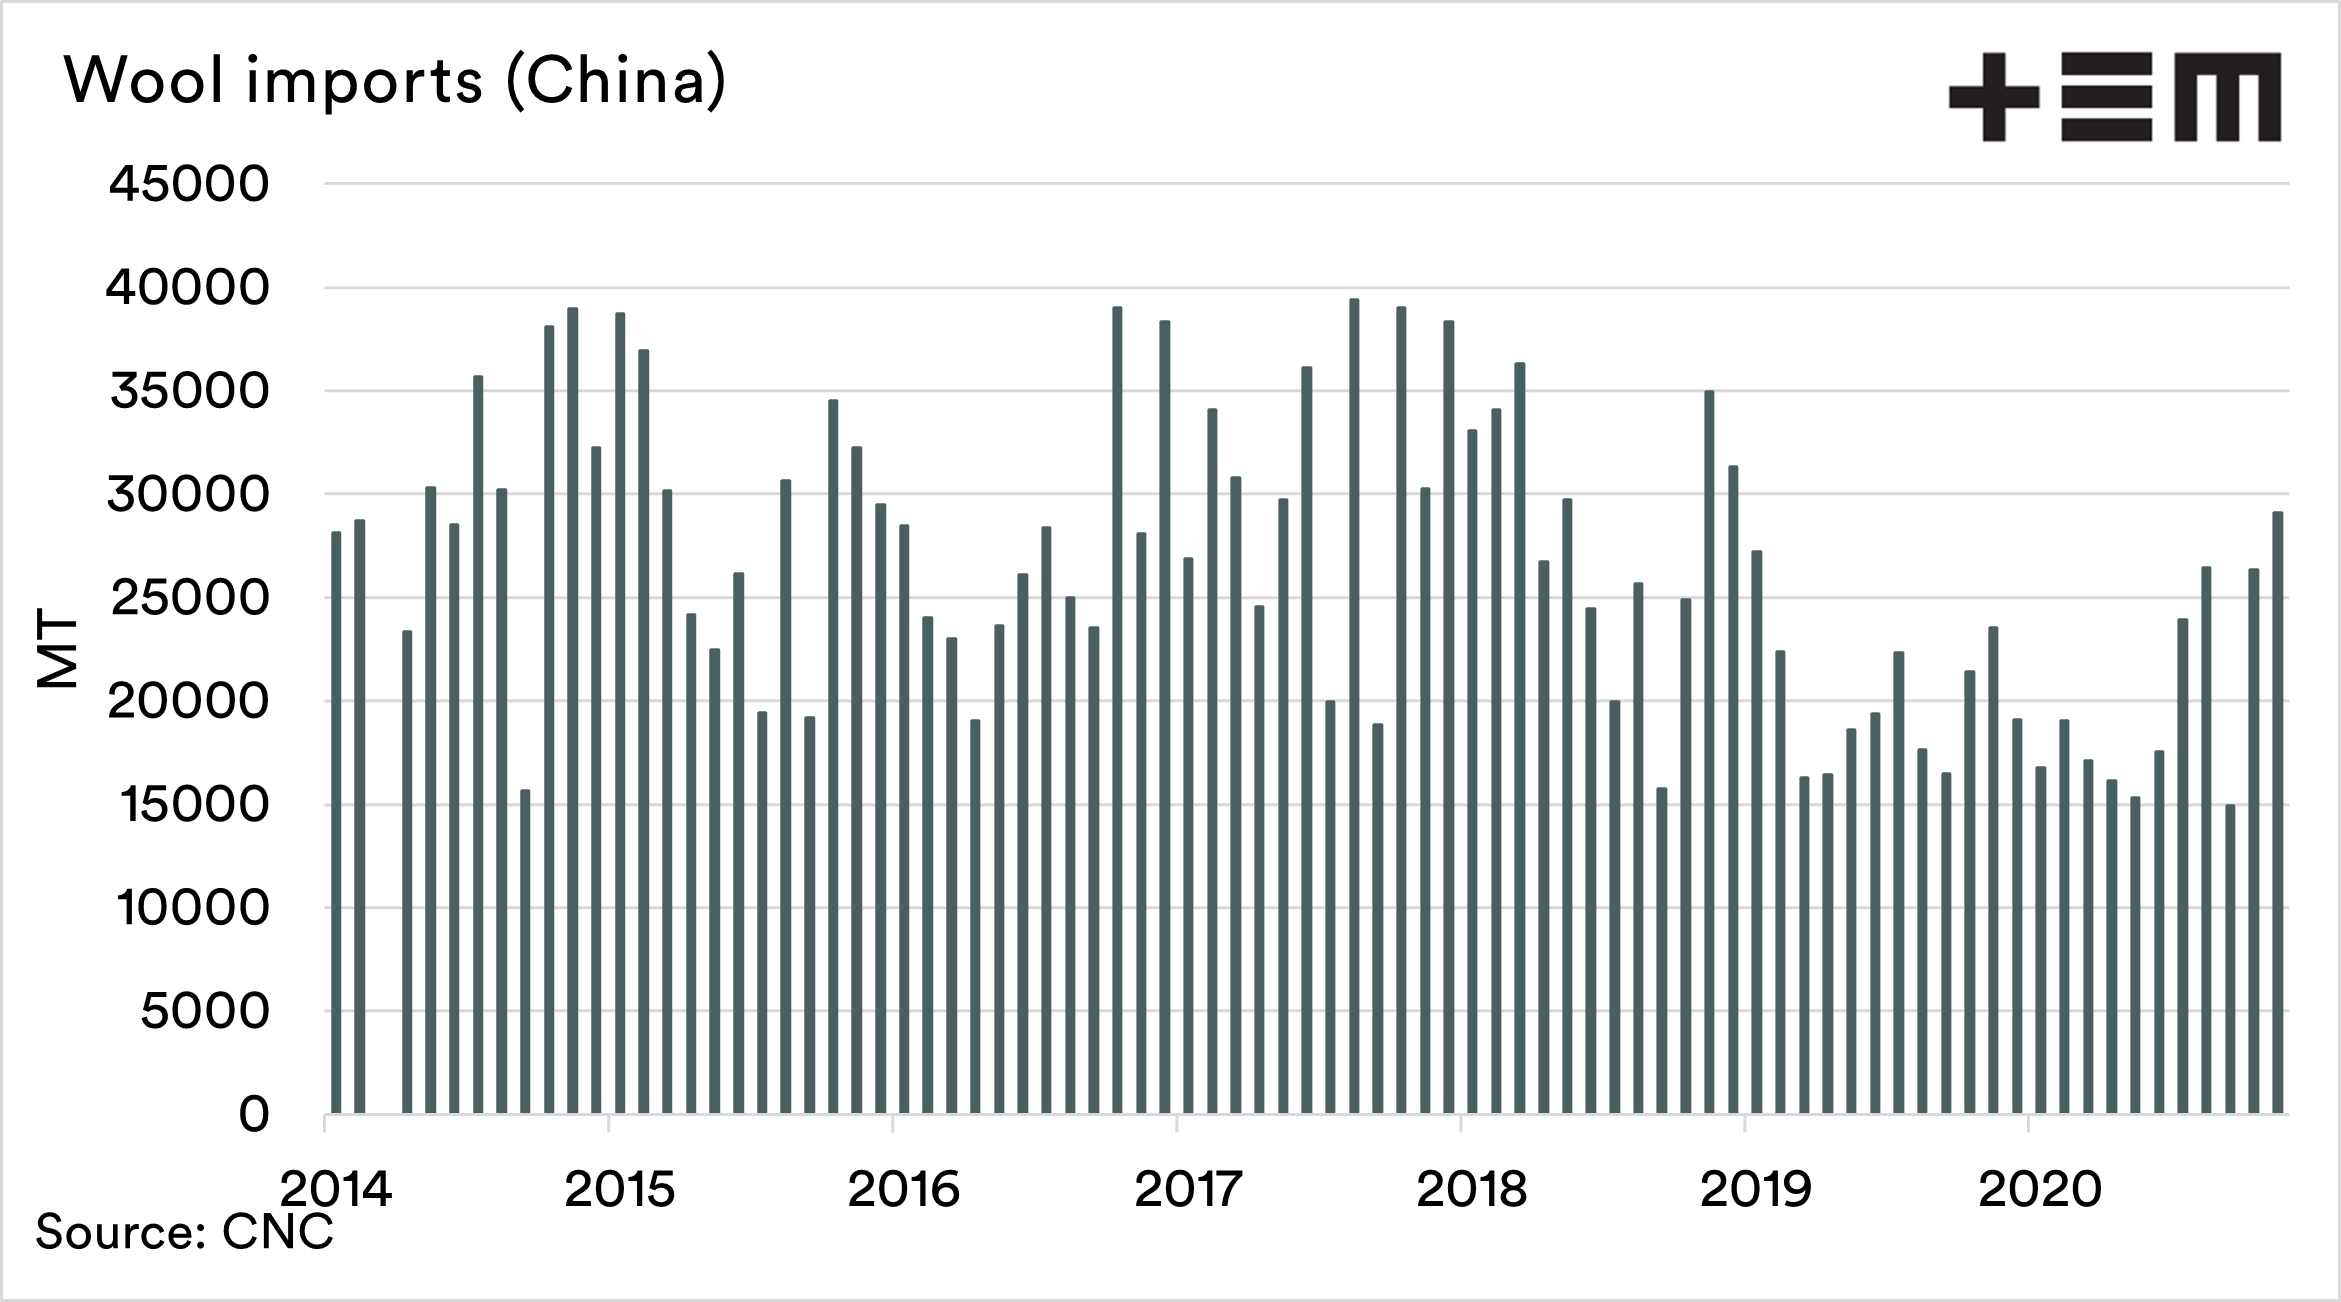
There was a sharp fall in July 2019, and levels have struggled to get to levels pre this level. Whilst this data set is only a snapshot of recent years, the trajectory of wool has been sliding whilst cotton ascends.
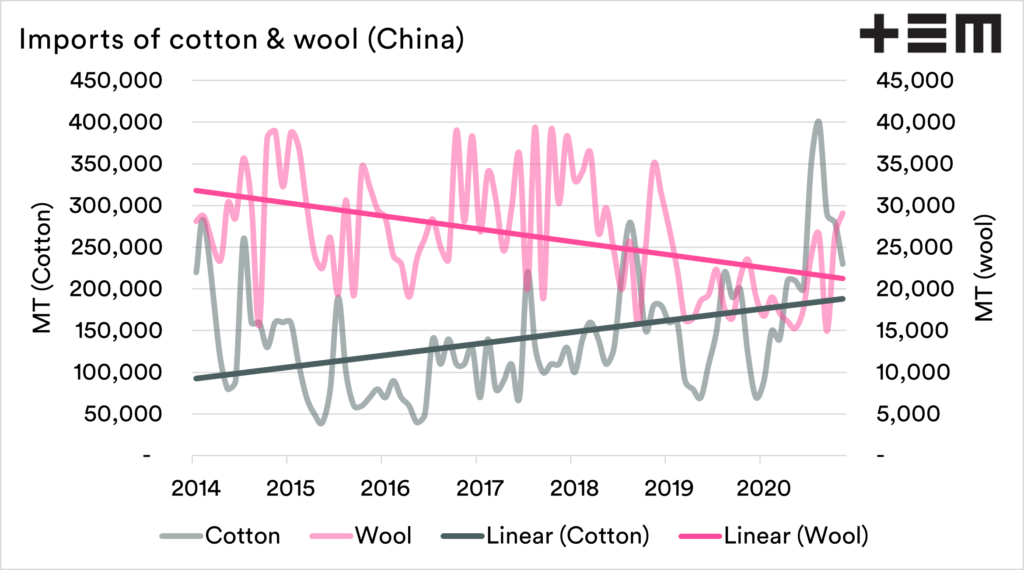
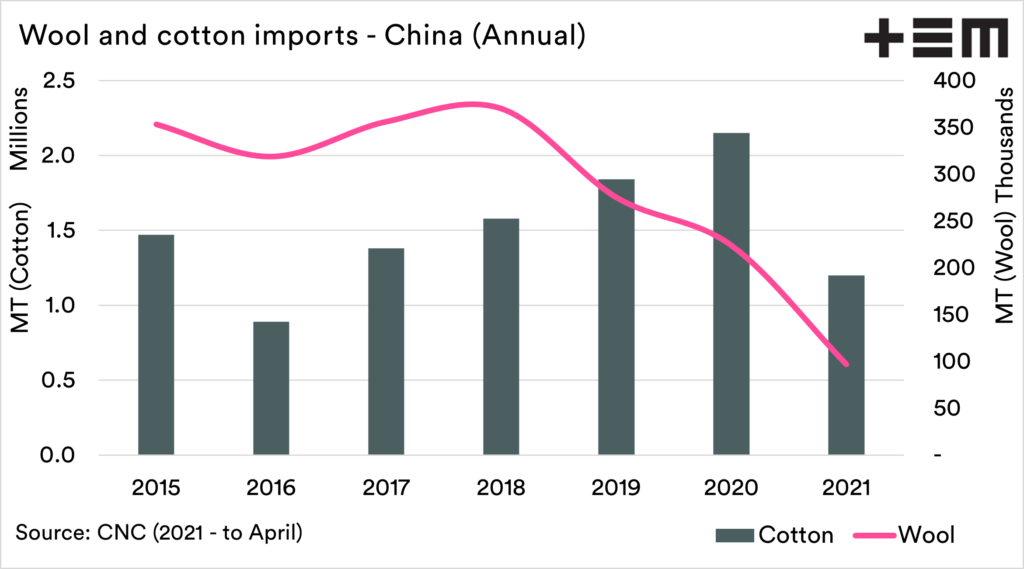
The charts below show the monthly imports of cotton and wool into China, along with the annual imports. The reality is that China is our biggest market, and they have been reducing imports in recent years, importantly – before COVID-19 was a factor.
The question is whether this reduction in wool imports is structural, will wool exports increase. Did wool get too expensive compared to cotton (see here)? Did demand for premium woollen products decline? Are there large stockpiles of woollen items?

