Buy high, sell low.
The Snapshot
- The fert-wheat ratio is useful for showing the trend and the potential for a cost-prize squeeze. It shows how many tonnes of wheat you need to sell to buy one tonne of fertiliser.
- The reality is that showing the spot grain against spot fertilizer price only reveals a limited picture. Farmers don’t generally purchase inputs and sell grain at the same time.
- If we currently were achieving the long term fert-wheat ratio of 1.33, we would be looking for A$725/mt for our wheat.
- We have revised the fert-grain ratio to examine the ratio at the time of fert purchase and the time of grain sale.
- This can be very variable, both positive and negative. If the grain price rises, then that makes the ratio lower.
- The reality is that the grain price can dramatically reduce between the start and end of the year, primarily due to events in the northern hemisphere.
- We need to be aware that the grain price can move southwards between input purchase and grain sales.
The Detail
When you are analyzing markets, it is not an instantaneous process. It is iterative; it is about refining and revising. We take what we have done and then see if we can look at it from a different angle.
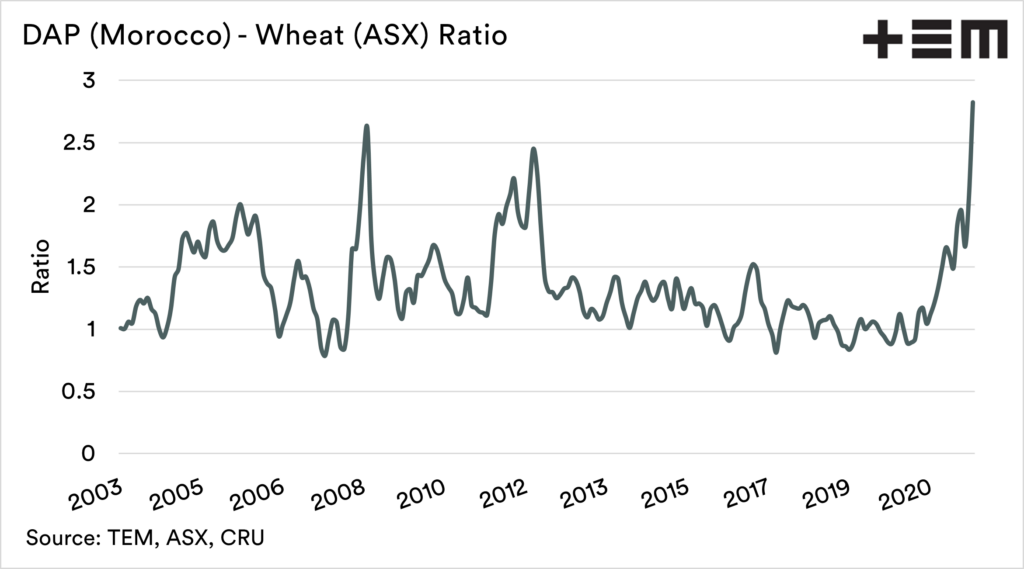
One of the things I have been mulling over the weekend is the ratio between wheat and fertilizer pricing. I have used these charts regularly when we discuss fertilizer. The reason why this ratio is important is that it shows a cost-price squeeze.
The chart below shows the ratio of wheat that you need to sell to purchase one tonne of DAP. In this case, I have used the ASX wheat contract against the FOB cost of DAP in Morocco. The purpose is to show the trend.
In this case, we can see that in October, the ratio has reached the highest average since at least 2003. Currently, 2.8mt of wheat needs to be sold to buy a tonne of DAP*; during the previous peak in 2008, the ratio was 2.6.
This isn’t the whole story. There are more significant factors to look examine.
Mismatch between buy and sell.
As farmers, we don’t tend to purchase our fertilizer and sell our wheat simultaneously. There is a lag between the purchase and the sale.
Purely as an example, most in Australia purchase their DAP from January to March. While forward selling is common, most wheat in the country is not sold by farmers until 10 to 12 months later.
The ratio that is generally used is the ratio of the spot price of wheat/corn/canola versus the spot price of fertilizer. In reality, this is simplistic and should only really be used for showing the trend and getting an indication of relative value.
We need to examine this in a little more depth. As mentioned previously, our input purchases are generally separate from our grain sales.
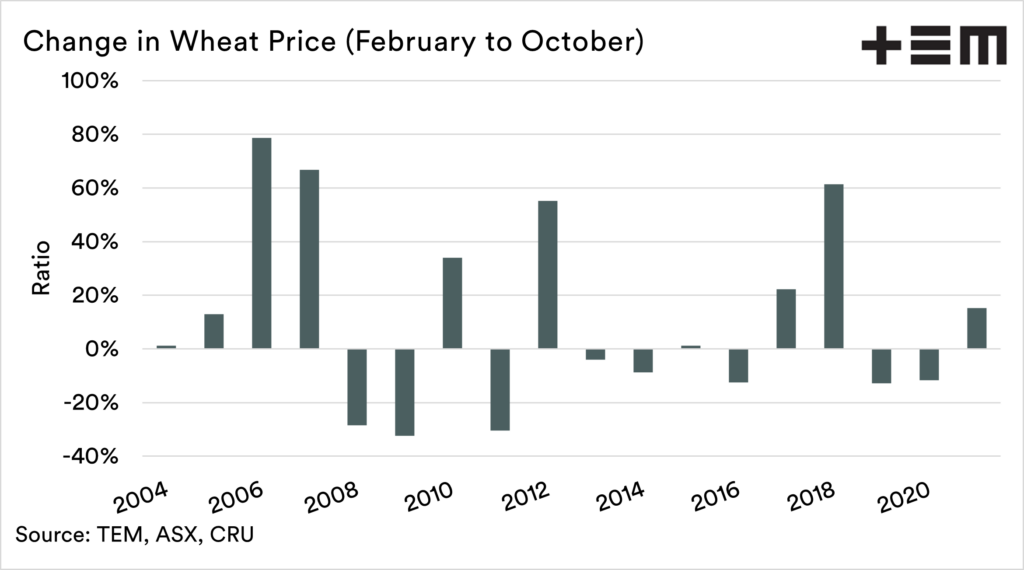
So that is the purpose of the chart below.

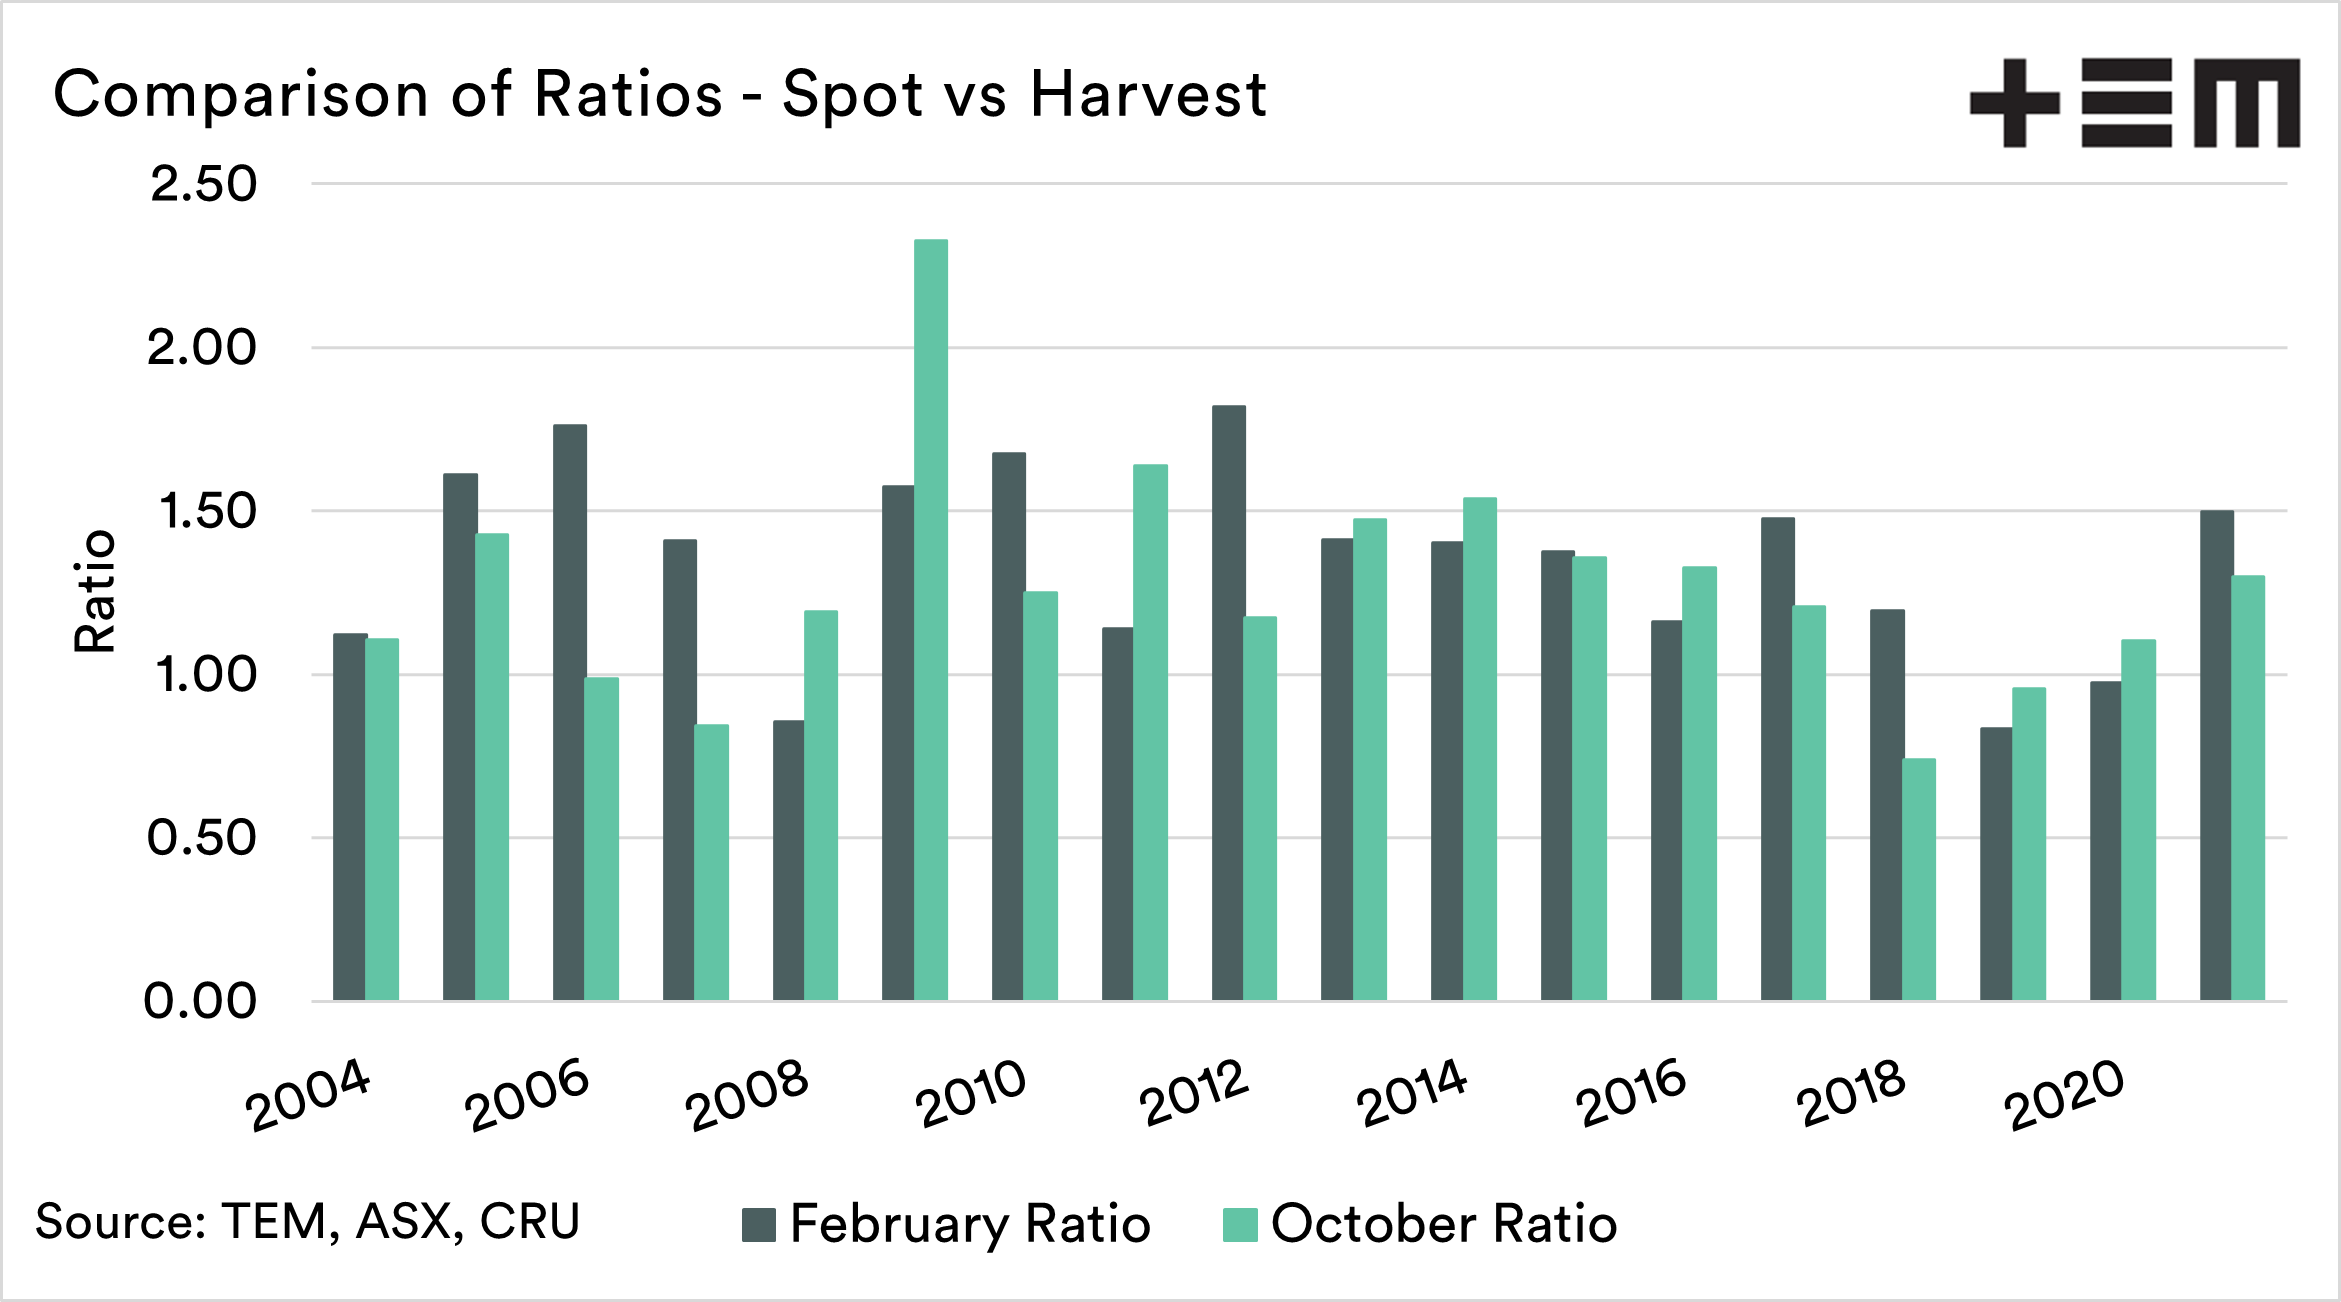
The February ratio represents the amount of wheat sales required based on the sales value on the spot. We also display the October ratio when you combine the purchase price in February with sales of wheat during October.
There is a large amount of variation between the two. Over a long period of time, the difference between the two largely evens out. There are times when the ratio improves and times when it diminishes.
During 2006 the grain price increased dramatically, meaning that you needed to sell less wheat to cover your fertilizer bill from earlier in the year. The ratio was reduced by 0.8mt.
Conversely, we can see in 2009 that the ratio worsened. This was due to a very large fall in the grain price. The year saw the ratio increase by 0.78mt.
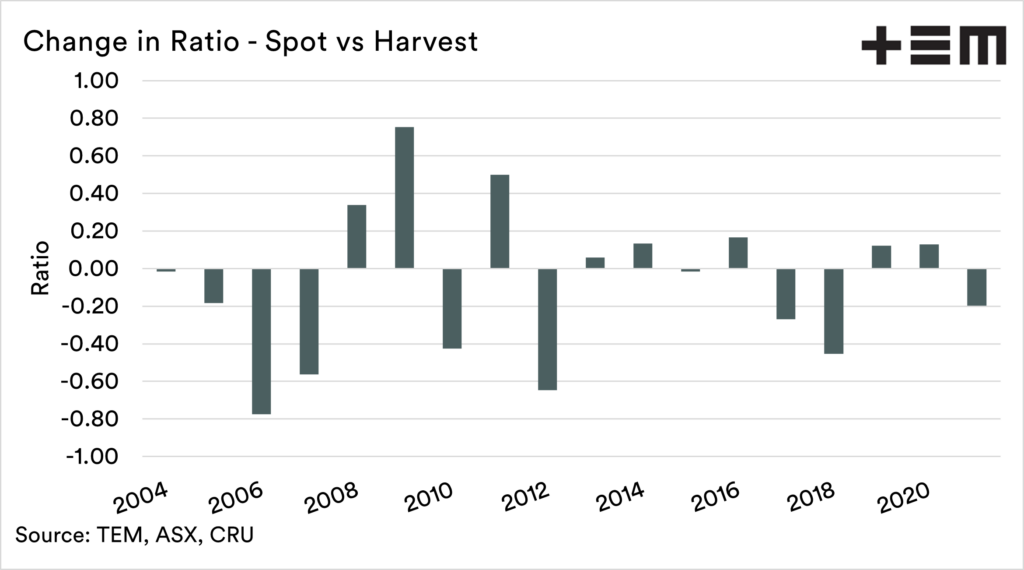
The change in ratios can be seen in the chart below.
So what is the risk?

Pricing pain.
The biggest risk for a grain farmer in the coming year is buying high priced inputs but not having high priced grain. At present, the grain price is attractive enough, albeit there is still a definite cost-price squeeze.
The chart below is a simple representation of the change in price for ASX wheat between February and October. This is to provide a simple illustration of the change in price.
There is largely no relationship between the price during the early part of the year and the end of the year. After we purchase our inputs, we will largely have the rest of the world between then and our harvest.
The big risk is that parts of the northern hemisphere recover their grain production and that grain prices fall by the time it comes to our harvest.
So what do we do about it?
- Selectively use fertilizers. Do we invest in soil sampling/ variable rate applications etc, to reduce wastage?
- Perform more forward sales. If the price is good around the time of fertilizer purchase, then maybe we lock in some price. This is removing price risk but adding production and washout risk.
At the moment, no one, absolutely no one, can work out what next years northern hemisphere crop will be like. That will be the big driver of whether we are ‘buying high and selling low’. A bad crop in Russia/Europe/North America will mean that the cost of fertilizer shouldn’t be too fazing.
If you liked reading this article and you haven’t already done so, make sure to sign up for the free Episode3 email update here. You will get notified when there are new analysis pieces available and you won’t be bothered for any other reason, we promise. If you like our offering please remember to share it with your network too – the more the merrier.