Is Canola a ticking time bomb?

The Snapshot
- The canola stocks to use ratio is at the lowest level since 2003.
- The major nations of Australia, Canada and Europe are set to have the lowest stock levels since 2003.
- At the end of this season, stocks are forecast at 1.8mmt.
- The average between 2010 and 2020 was 4.7mmt.
- In the same period of time these nations have increased domestic consumption from 15.3mmt to 33.2mmt.
- The canola supply and demand picture is tight going into the new season.
- The canola market could explode if a major production issue occurs or be defused by a return to normal levels.
The Detail
The stocks to use ratio is a useful indicator of both the supply and demand of grains. A higher end stock to use ratio represents a commodity with a healthy supply, and therefore lower pricing. A lower stock to use ratio generally indications a tighter scenario. A tighter market tends to result in higher pricing.
A few weeks ago, we took a look at the wheat STU (see here); this week, I thought it was worthwhile looking at oilseeds after our report the other day on ‘Aussie replacing Canadian Canola‘.
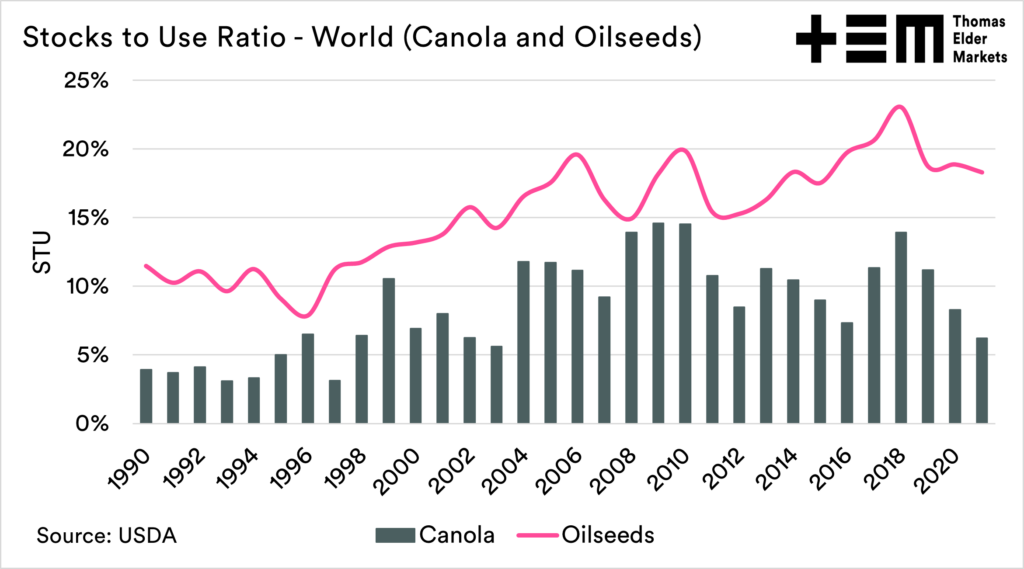
The chart below shows the stocks to use ratio on a global basis for the combined oilseeds and canola. The canola stocks to use ratio is at 6%. This is the lowest level since 2003; on average, since 2010, the STU for canola has been 11%.
Canola doesn’t operate in a vacuum. The oilseeds have a large degree of replaceability between themselves. The STU ratio for overall oilseeds includes copra, cottonseed, palm, peanut, canola, soybeans and sunflowers.
The stocks-to-use ratio is 18%, only slightly lower than the past two years and about average for the past decade.

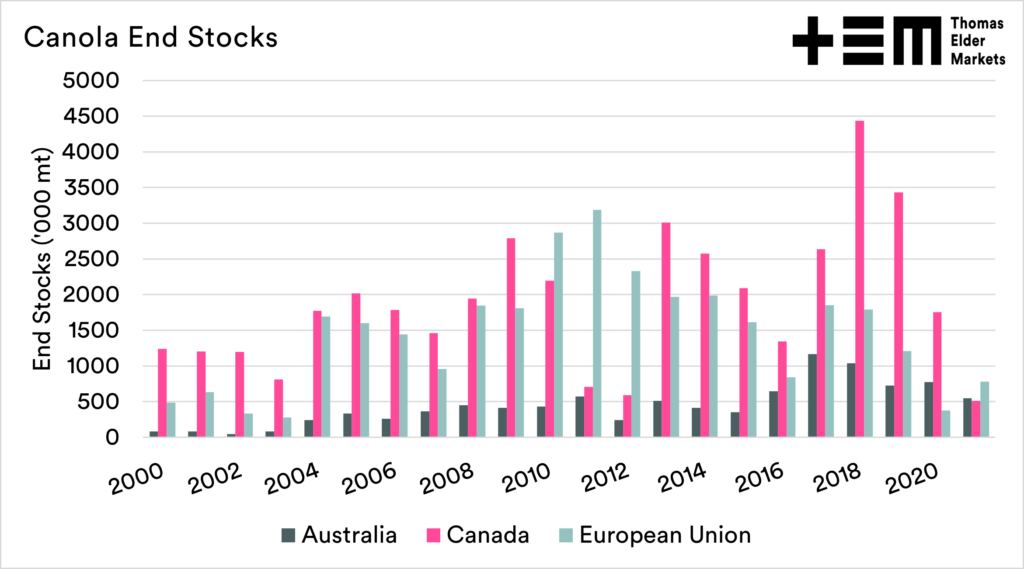
Let’s delve into canola in a bit more depth. The chart below shows the end stocks of canola for Australia, Canada and the European Union.
Canada is unsurprisingly forecast to have low stocks, at 550kmt versus an average of 2.2mmt since 2010. The drought combined with high domestic consumption has resulted in a significant drawing down of stocks.
European stocks are forecast to recover from last years lows of 380kmt to 780kmt, albeit well below the 2010 to 2020 average of 1.8mmt.

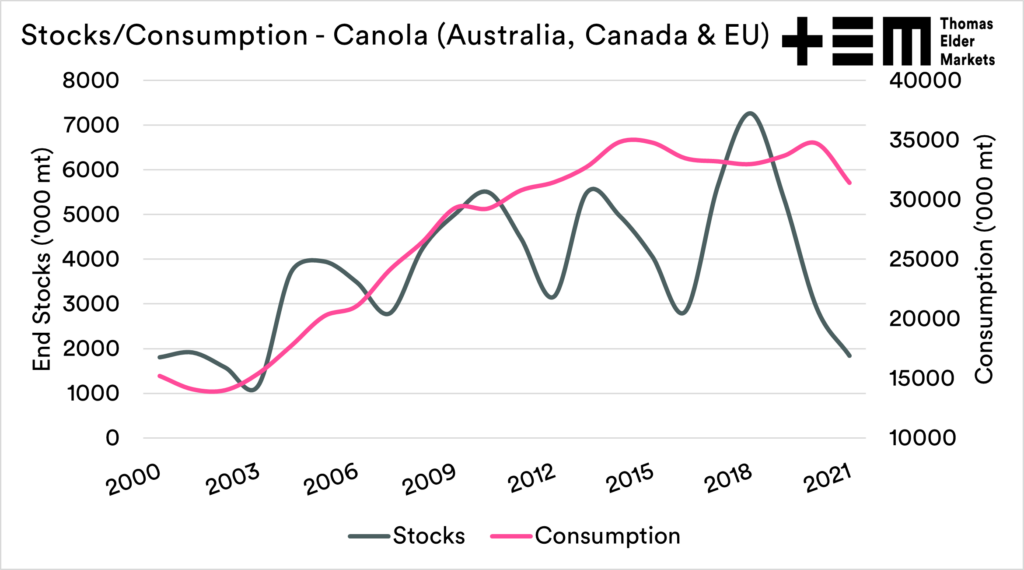
The chart below shows the combined end stocks of Canada, EU and Australia at the end of the season. I have combined these to give a more straightforward representation of the environment. The stocks levels across these three regions are set to be the lowest since 2003. The average stock levels between 2010 and 2020 were 4.7mmt. At the end of this season, they are forecast at 1.8mmt.
This is extremely tight, especially when we consider domestic consumption growth in just these three regions. In the past five years, consumption has averaged 33.2mmt, versus 15.3mmt for the first five years of the 2000s. A 117% increase

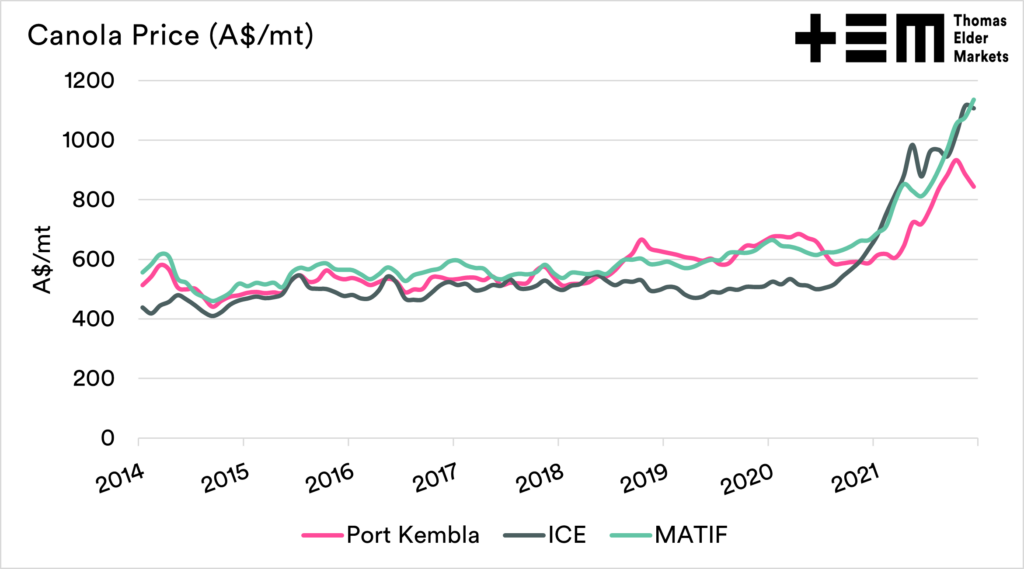
It’s all a bit tight when it comes to canola at the moment. The market’s tightness has resulted in rising pricing levels to very strong levels. Even with the recent fall in pricing levels around the country, the price is still historically very attractive.
The big question is – what about next year? The world will be watching the weather in Canada and Europe for its direction. A failure in either will result in fireworks, as the starting point of the coming season is for an empty pantry.
However, the reality is that we don’t know how it will turn out. It could be a supply shock, and alternatively, the world could be awash with a bumper crop.
For this seasons crop, the price is attractive, and pressure on local pricing may continue to play its part. The good thing is that there have been ample opportunities to lock in good pricing levels throughout the season.