Market Morsel: Forward to the future

Market Morsel
A forward curve is an important tool, as it provides a quick visual of how the forward markets are performing. Importantly it gives an outlook on what you will receive if you lock in pricing further along the horizon.
To learn more detail about the forward curve, click here
The charts below show the forward curves for canola and wheat; both converted to A$.
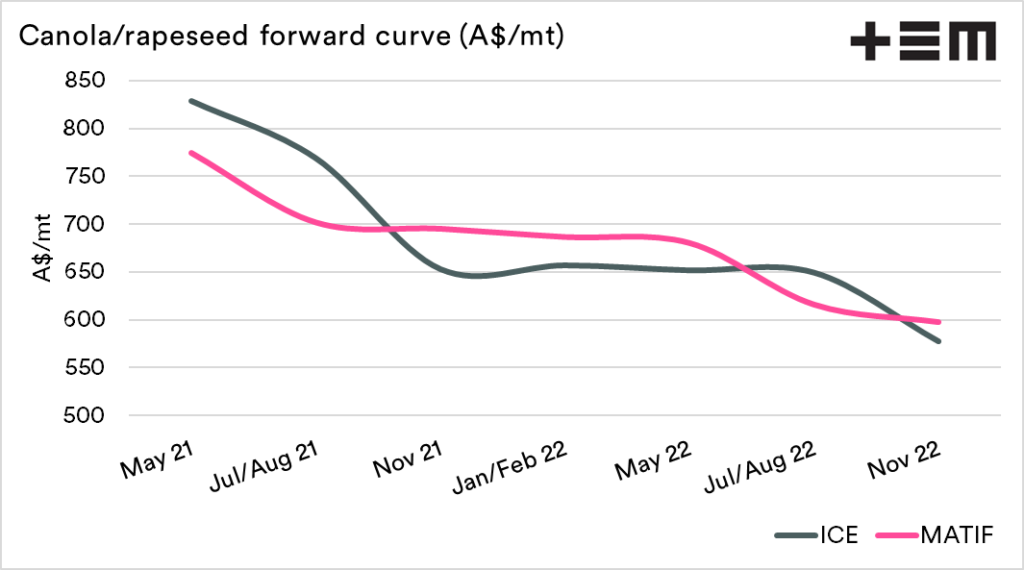
Canola:
This chart includes both ICE (Canada) and Matif (France). The market is currently in backwardation (or inverse). This means the market is offering a higher price for the nearby months than further along the curve.
This usually occurs when the market is more concerned with the current situation and wants access to the commodity asap, instead of in the future.
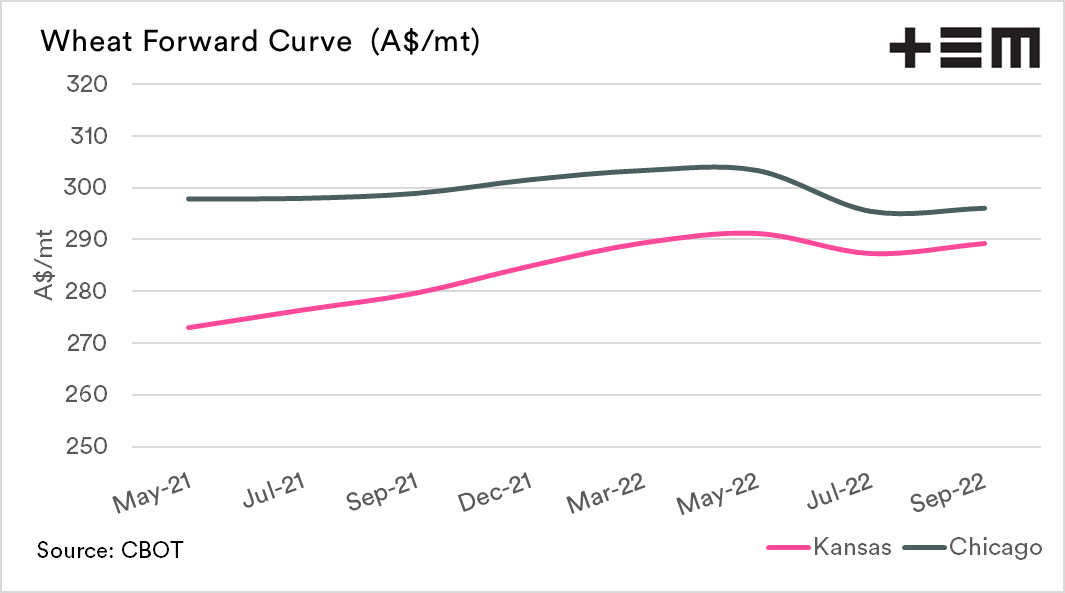
Wheat:
This chart includes both Kansas and Chicago wheat. The Kansas market is in a slight contango (or carry) pattern, with forward months offering a premium to nearby. Chicago, on the other hand, is a little flatter.
It is relatively rare to see Chicago futures with a flat or discounted structure, which we wrote about in a previous article (see here).