Is the price you are being offered for wheat good?

The Snapshot
- The forward curve is flat, sloping downwards.
- This is a relatively rare occurrence.
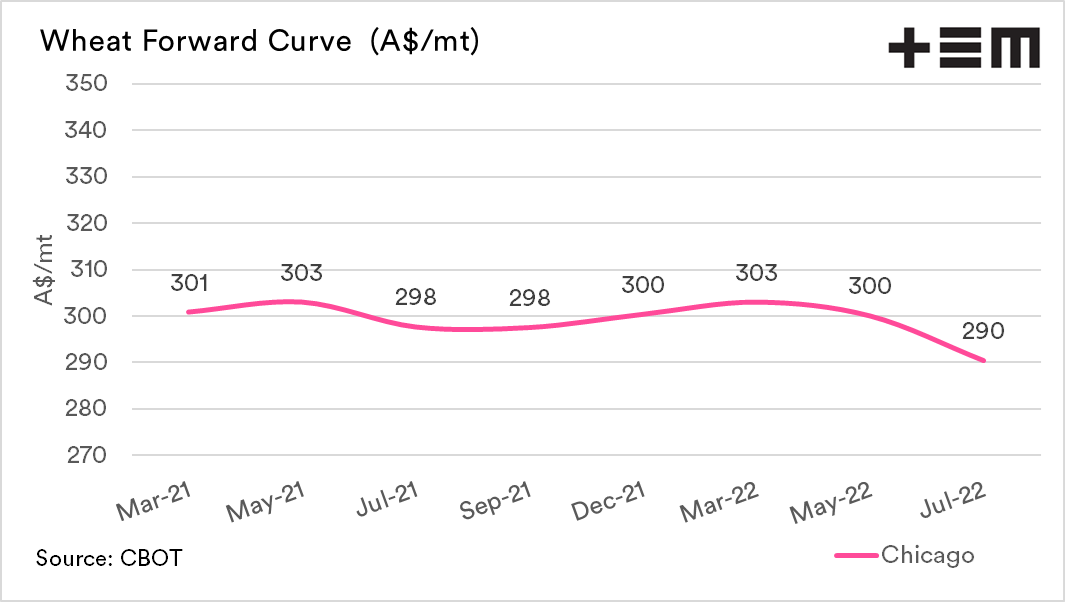
- The futures price for December is A$300
- The physical price for harvest is A$310 (Kwinana) & A$290 (Adelaide)
- This is a basis offer of +A$10 and -A$10.
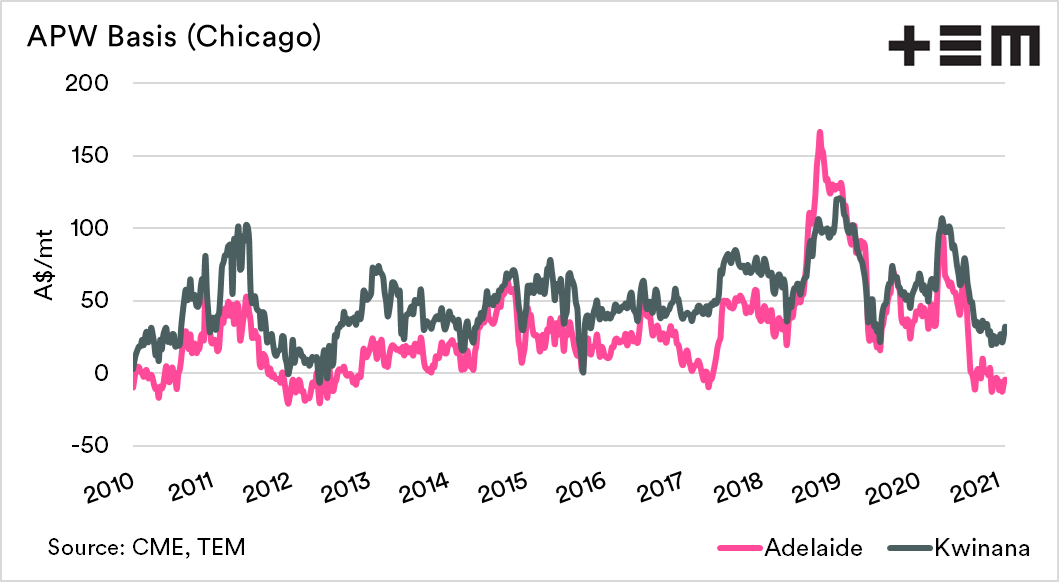
- The average basis in Kwinana has been A$50 since 2010, and A$28 in Adelaide.
- The physical offers for next year on offer at present have relatively low basis levels.
- It may be advisable to consider separating the futures and basis component of your pricing.
The Detail
Last month I wrote about the canola futures forward curve (see here). We regularly post the forwards curve for wheat on our twitter account (follow us here). However, I realised that we hadn’t touched upon the forward curve since October on the EP3 website.
This article will cover off on the forward curve, but with a practical application of using it to determine whether the physical prices on offer are attractive.
The forward curve is a chart which we will often refer to in EP3 articles, as it provides a quick view of the market. The forward curve details the price for each of the contract expiry dates for a commodity’s futures contract.
The curve gives an instant snapshot of where you could theoretically buy or sell the commodity. At the time of writing, the forward curve is flat with a slope towards a backwardation (or inverse).
The spot price for Chicago wheat futures is A$301, whilst December is down a marginal A$1. The further down the horizon into 2020, the July contract falls to A$290. The majority of the curve is showing quite a flat structure.

A rare structure?
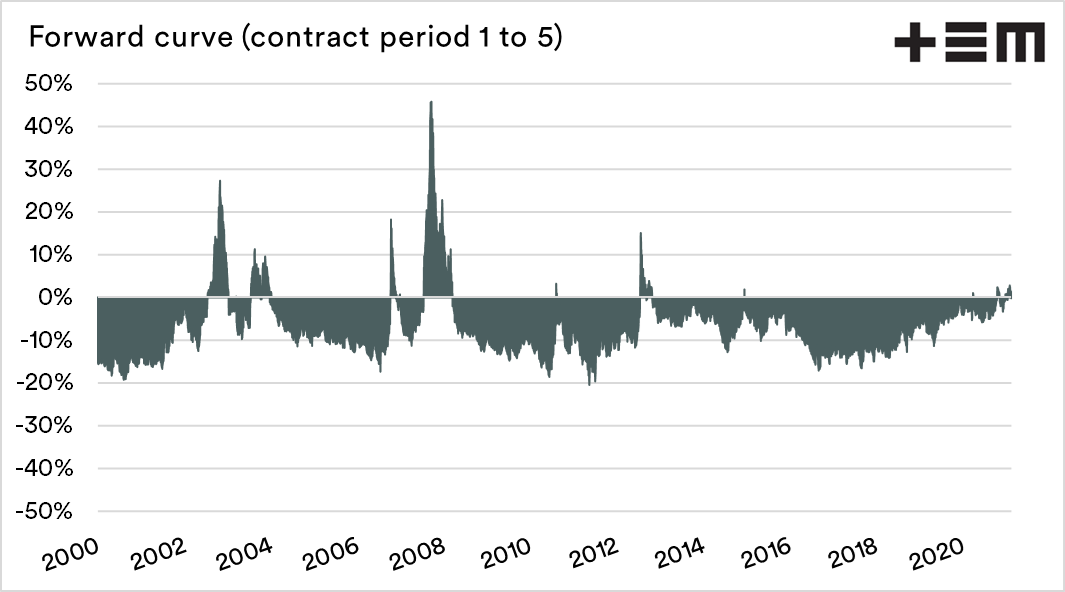
It is extremely rare to have the spot market at a premium to forward contract months. The wheat market tends to be on contango (or carry) for the most part. The chart below shows the premium or discount from the front month to the 5th contract.
When the chart displays a zero or below value, this shows the spot contract is at a discount, and the market is willing to pay a ‘carry’ for forward months. In this chart, we can see that there are very few times when the market operates with spot either at a premium or at parity with later months.

Why does this happen?
A market structure like this tends to occur at times when a commodity is scarce. The market in a flat or backward structure effectively tells us that the trade is more concerned about gaining access to the commodity at present – not in a year.
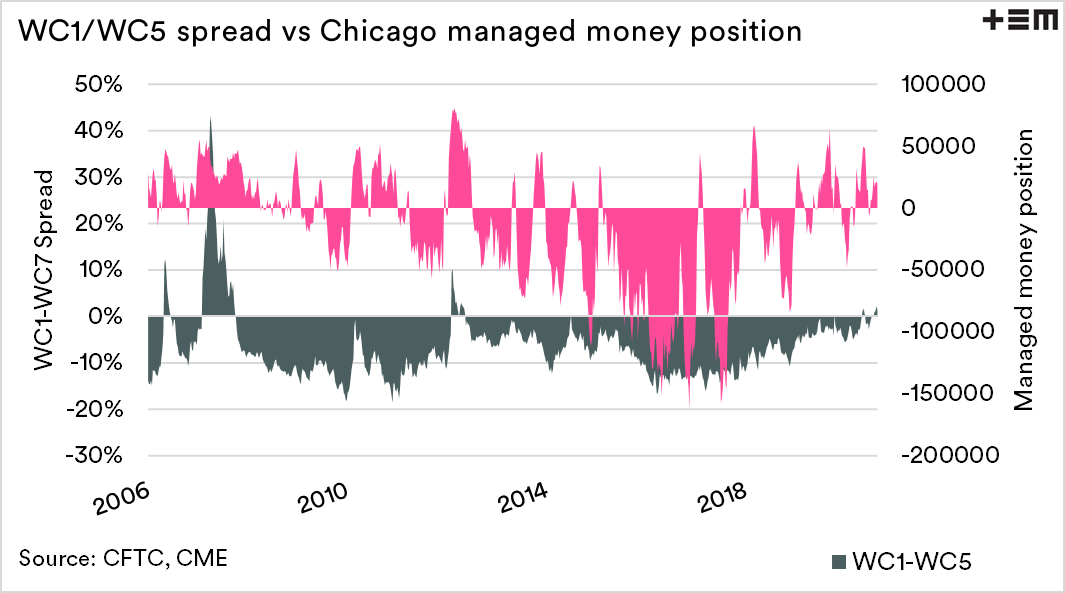
Interestingly, backwardation has only occurred when speculators are long on wheat. This points towards speculators in the wheat market generally only interested in what is immediately ahead of them. Hedgers, on the other hand, are as likely to be interested in forward months.
To read more about speculators read here

Is the forward price attractive?
As we approach seeding, many will consider their marketing strategies, which may involve taking some early physical contracts for the coming harvest.
At EP3, we believe it is essential for farmers to understand their price and what it comprises. I have selected two port zones to determine whether the price is attractive or not.
- Kwinana – A$310
- Adelaide – A$290
The two prices above are APW1 multigrade contracts for the coming harvest. In the forward curve in the first section of this article, we know that December’s futures price is A$300. This means that Kwinana has a basis level of +A$10, whilst the Adelaide offer is at -A$10.
it is important to understand basis, as it can be the cream on top. I put together a quick guide back in August (see here). In summary, high basis is due to low supply, and low basis is due to high supply.
At present basis levels around the country are on the low end of the scale due to the recent bumper crop.
The average basis level for Kwinana has been A$50 since 2010, and in Adelaide, it has been A$28. This timeframe has included times of both drought and plenty.
In February, no-one has any idea of the condition of the end crop. The basis level could be high or low. If we look at both of the basis levels provided, they are substantially below the long term average.
This offers some protection for the buyer, in case supply is huge, they won’t be as impacted by falling basis. However, if basis levels rise to higher levels, then they will be able to participate.
This gives the buyer the ability to purchase and protect their futures exposure while having a basis risk relatively low compared to historical levels.
It may be worth considering a strategy that separates your basis pricing from the futures component of your pricing as a seller. At these pricing levels, the basis on offer is below the long term average and is only likely to be an attractive level, in a year of large production.