2023 is a record year for Urea imports to Australia (so far)

The Snapshot
- May was a record month for Urea imports (since 2011).
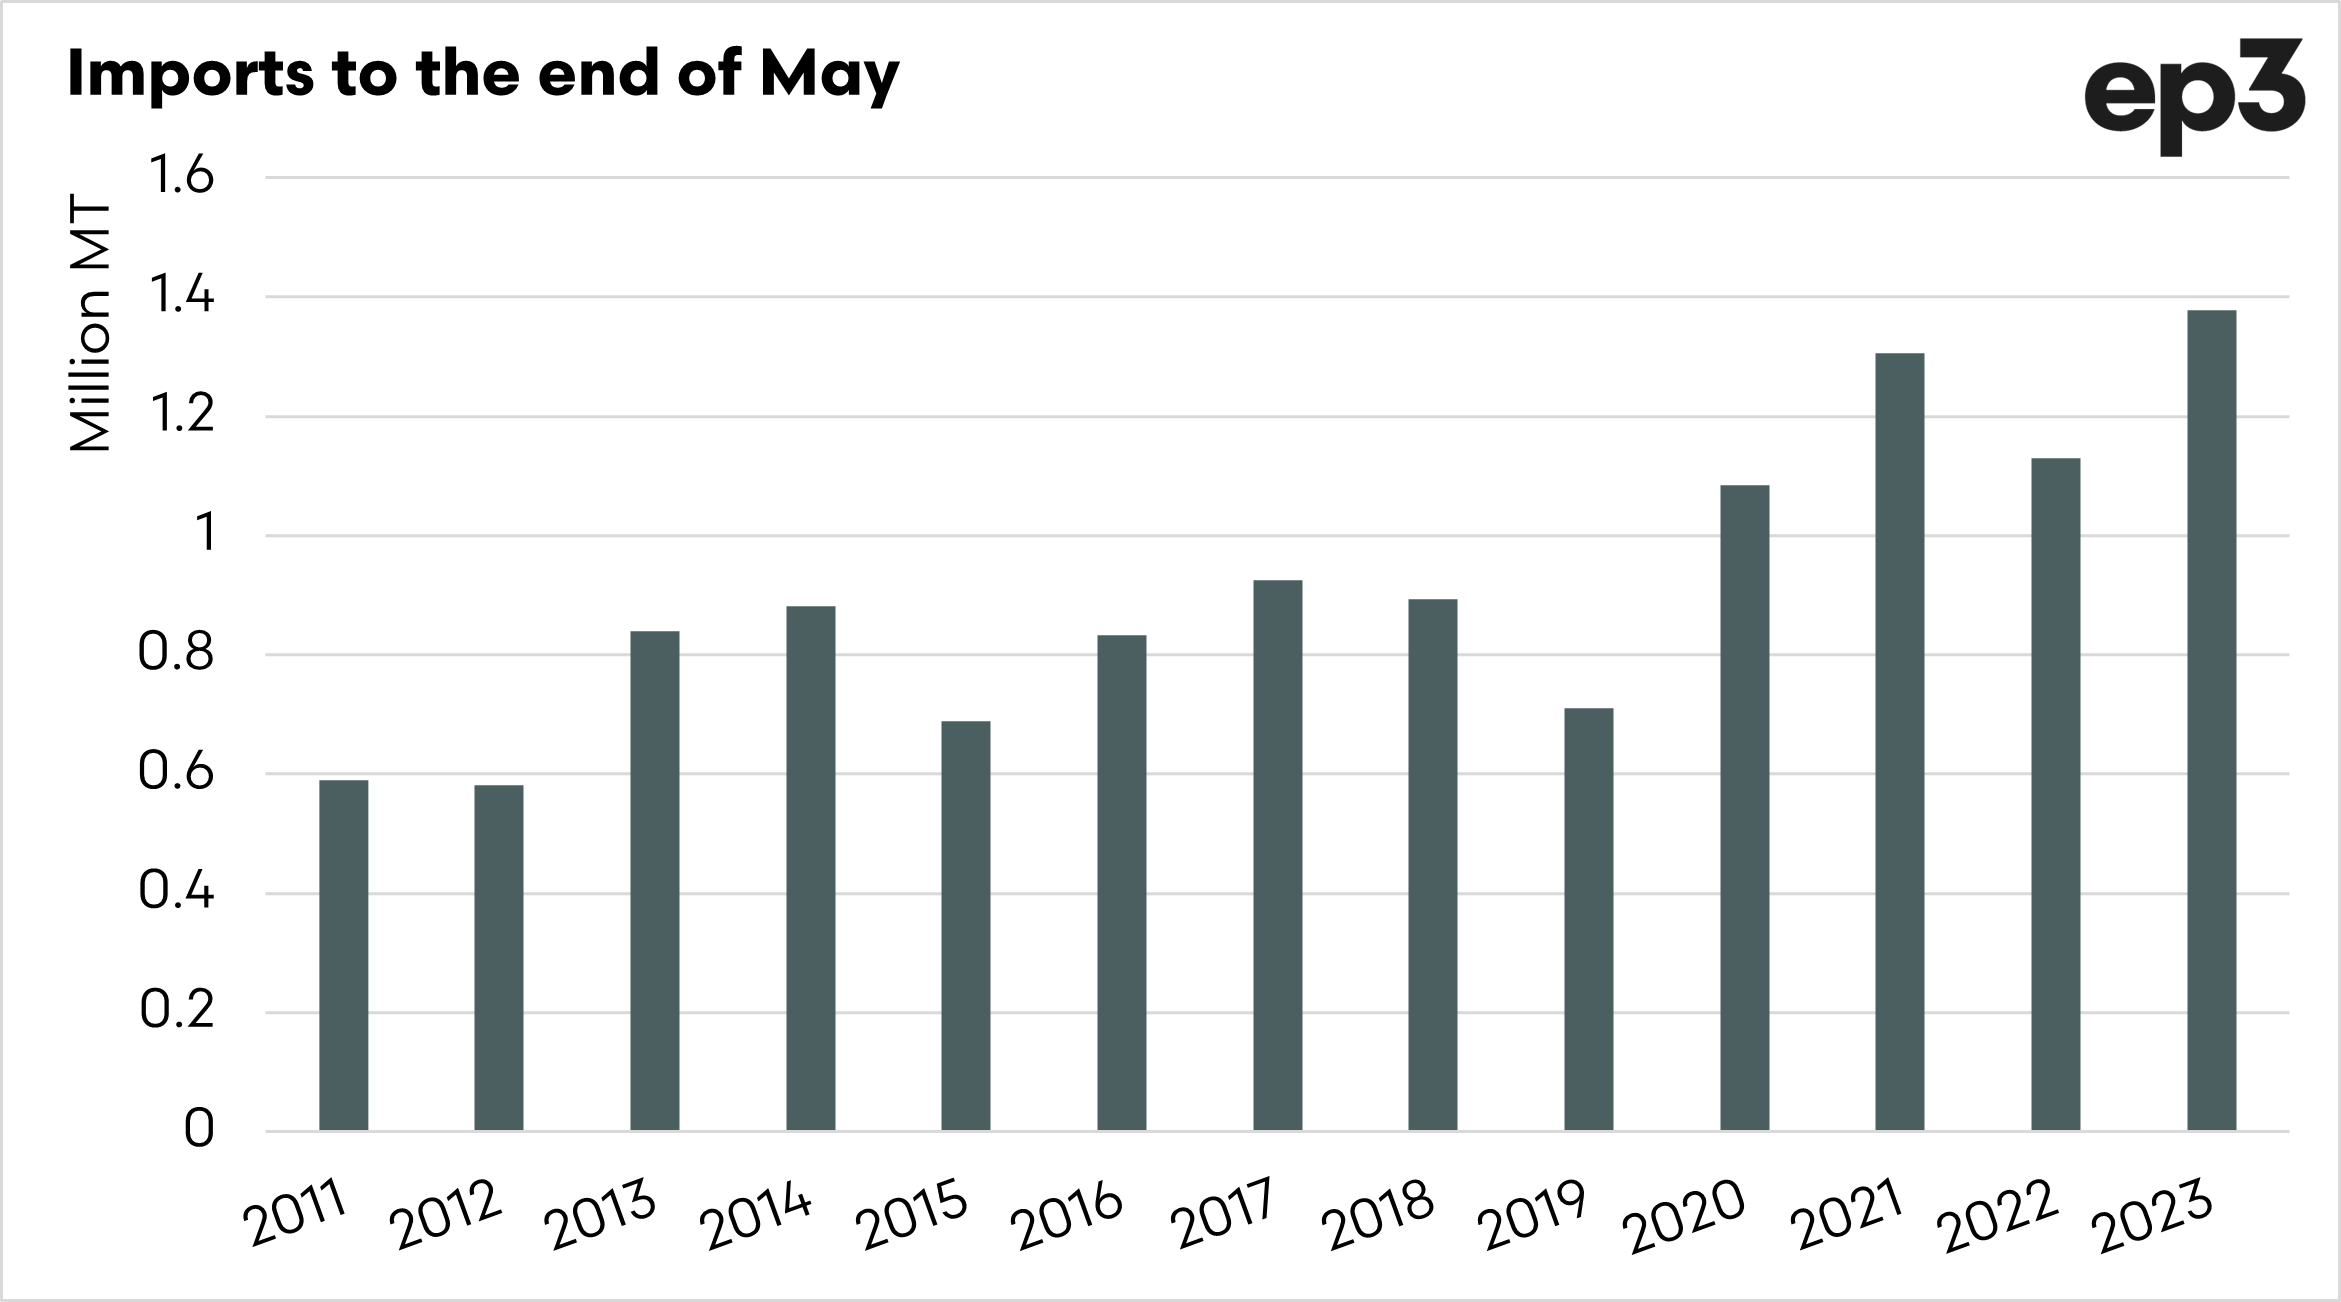
- Total imports for the year to the end of May are at records levels (since 2011)
- By the end of May, urea imports were 250kmt higher than last year and 350kmt higher than the five-year average.
- Whilst imports are high, these are national imports and may not be reflected in the local supply situation.
- Domestic production has fallen, which necessitates higher imports.
- Import pricing decreased in May to the lowest level since mid-2021. The import price was A$543
- There is clearly a supply issue, as many have limited access to urea.
The Detail
The are concerns at the moment about the availability of urea in Australia. The weather has changed, and farmers’ cocaine has been in short supply. This article will look at urea imports into Australia for 2023 and pricing.
The data on fertiliser imports into Australia is delayed because the May imports have only recently been released. So the data we are using does not include June.
Let’s look at the seasonality first.
We provided an explanation of seasonality in this article
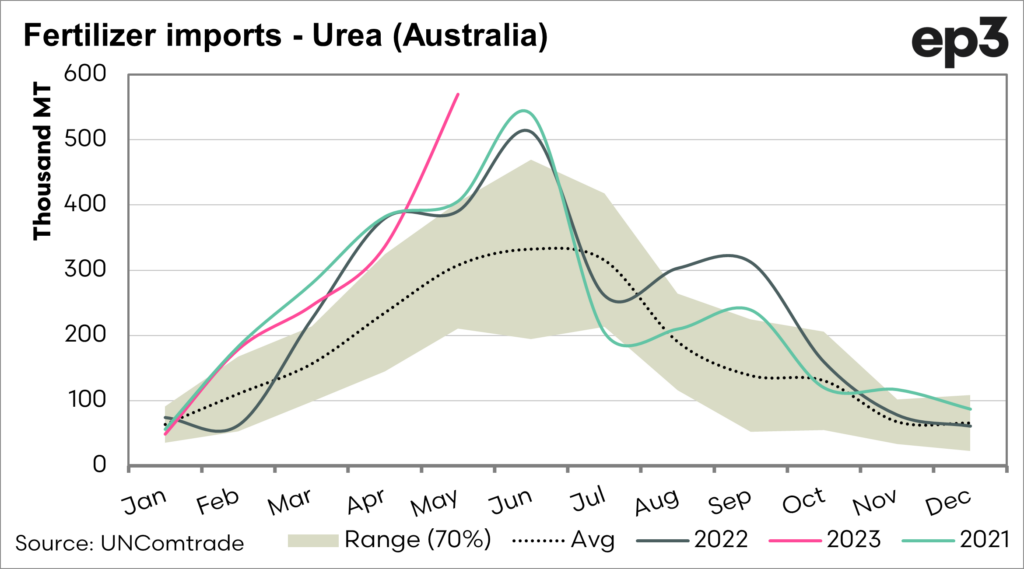
The chart below displays the seasonality of urea imports into Australia. During May, 570kmt of urea was imported into the country. This was the highest-ever month of urea imports. This year imports have been above the standard deviation and well above the average (2011 to present).
The usual peak month for imports is June, so it may be logical to expect that this year’s peak has come a month earlier due to the sheer scale of imports. We will see what June imports are like in a month.
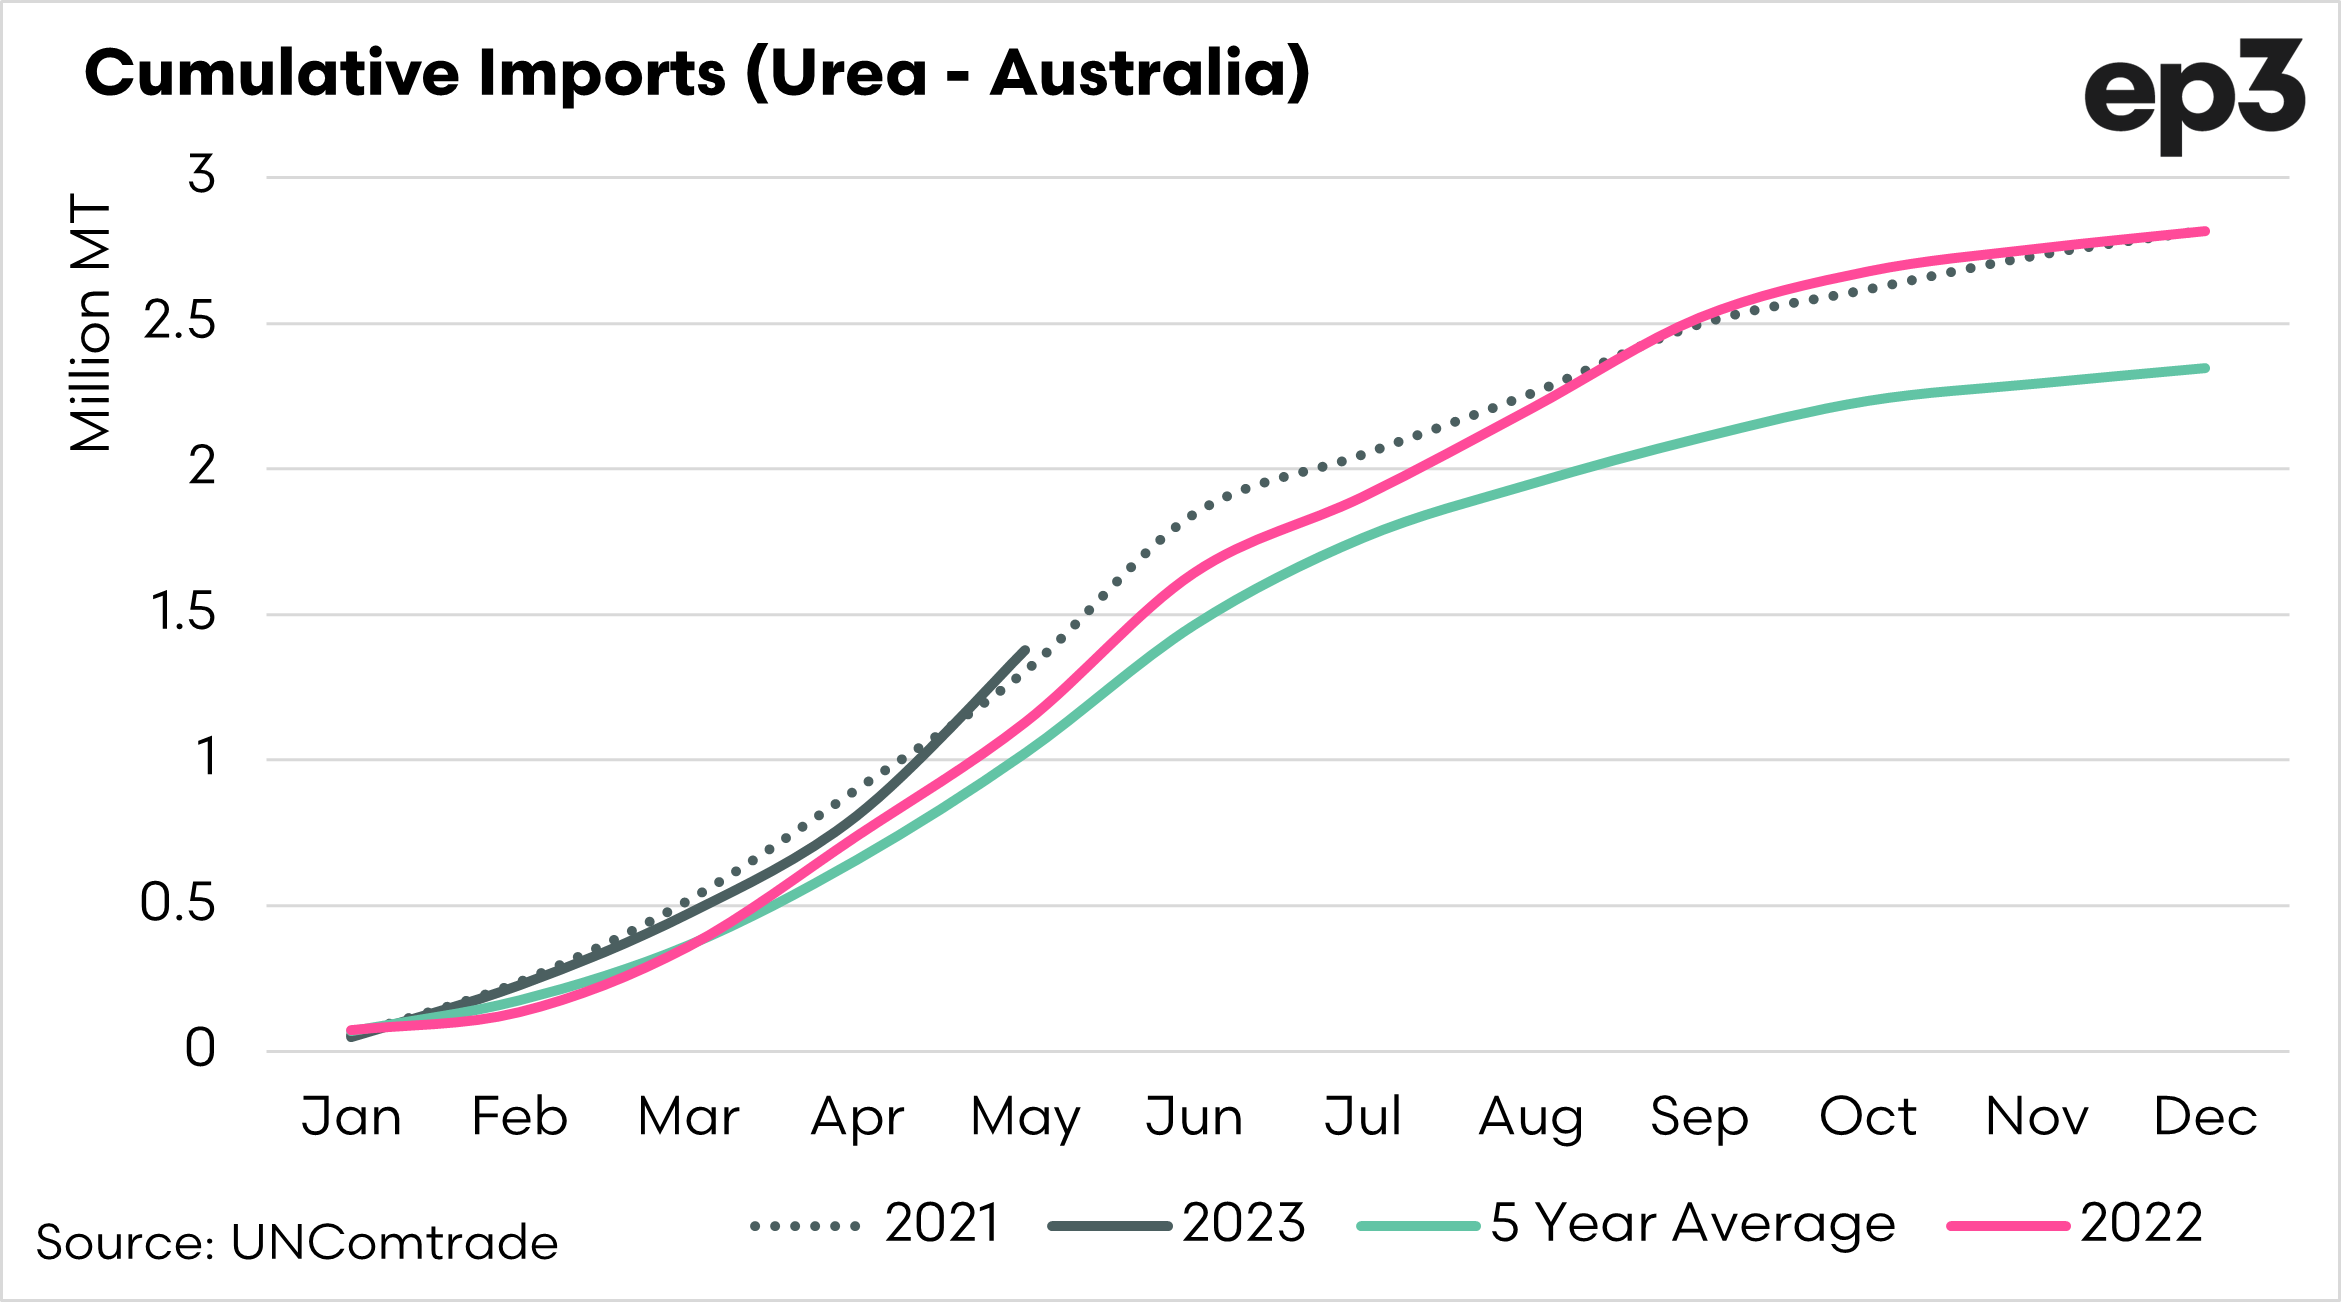
It is also essential to look at the cumulative imports of urea into the country. The chart below displays the total cumulative imports for the year.
I have chosen to display the five-year average in the chart alongside 2021 and 2022. I have chosen the five-year average as this includes years of low and massive demand for urea. The drought and the deluge.
Through using these time series, it provides a range of different years, with differing seasonal conditions.
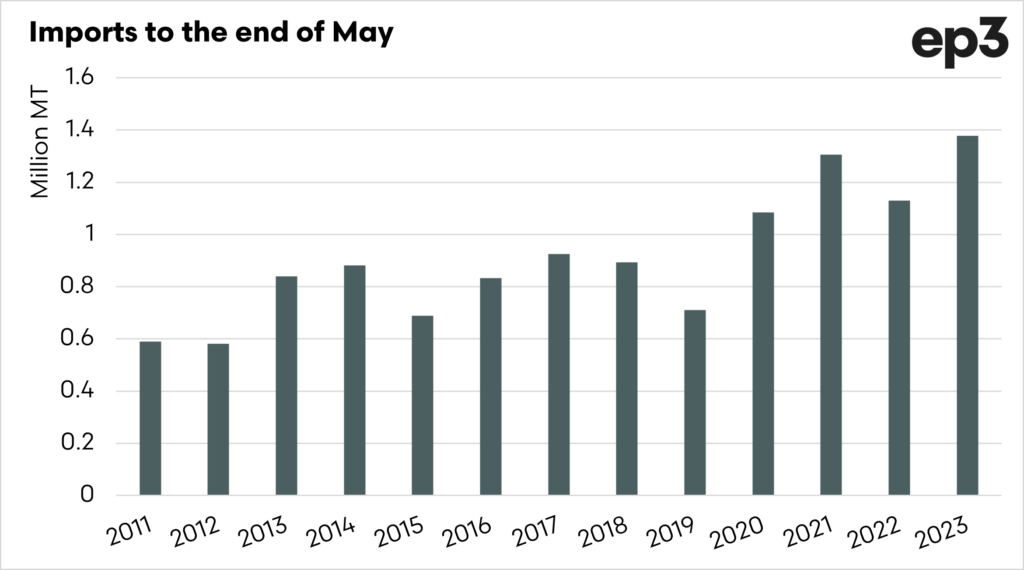
By the end of May, 1.37mmt of urea had been imported. The chart below shows the imports to the end of May for each year from 2011 to the present.
This year has a record level of imports, above both 2021 and 2022, both strong demand years.
In these charts, we can see that urea imports have been strong, even in comparison to recent years when demand for urea was high and obvious ahead of the typical import period of May/June.
There is very little information on the fertiliser trade and market in Australia that is independent. We are one of the few independent information providers and have no linkages with the fertiliser industry. The data available is relatively limited compared to other agricultural commodity markets in Australia.
What other considerations need to be taken into account?
- This data is the national imports; it, therefore, is not split into states. So whilst imports have been strong, the volume may not be in the right locations.
- Domestic production has declined, necessitating increased imports. Gibson Island produced approximately 280kmt of urea. Although we have covered this loss to an extent with 350kmt imported above the five-year average.
- Maybe Australia needs a more live import tracker to track what vessels are on the water. This would indicate what volumes would be arriving soon.
There are significant issues in the Australian fertilizer value chain which need to be addressed at some point. Australian farmers are very nervous about the situation, especially in light of local domestic production falling and declining trust.
I want to be clear. I do not deny that there is a fertilizer shortage in Australia, merely highlighting that urea imports up until the end of May were at record levels on a national basis. This is just pure data.
How it is used, or where it is, is a question that we can’t answer at this point.
Pricing
As an analyst, I have been covering fertiliser pricing in Australia for a long time. I have worked to try and improve price transparency in several ways. I thought I would look at pricing differently for this piece.
The chart below shows the import price of urea into Australia. It is important to note that this is a rudimentary price. It is taken by taking the total value of imports (CIF) divided by the volume for each month.
This doesn’t give us an exact figure because each vessel will be priced differently, but is merely used to show the trend of pricing levels. It is also important to note that this does not include on-shore costs or margins.
In May, the import price was A$543, down from the April price of A$561. It is the lowest import price since 2021. This is a pricing level that is attractive.
Is the price you are being offered reflecting this? Let us know in our pricing census by clicking here

