Market Morsel: Cotton spinning out from wool.
Market Morsel
No man is an island entire of itself; every man is a piece of the continent, a part of the main. The same can be said of fibres. No fibre is an island; they are part of the whole.
On a regular basis, we compare the fibres, as it provides a quick outlook on the market structure across the major fibre types.
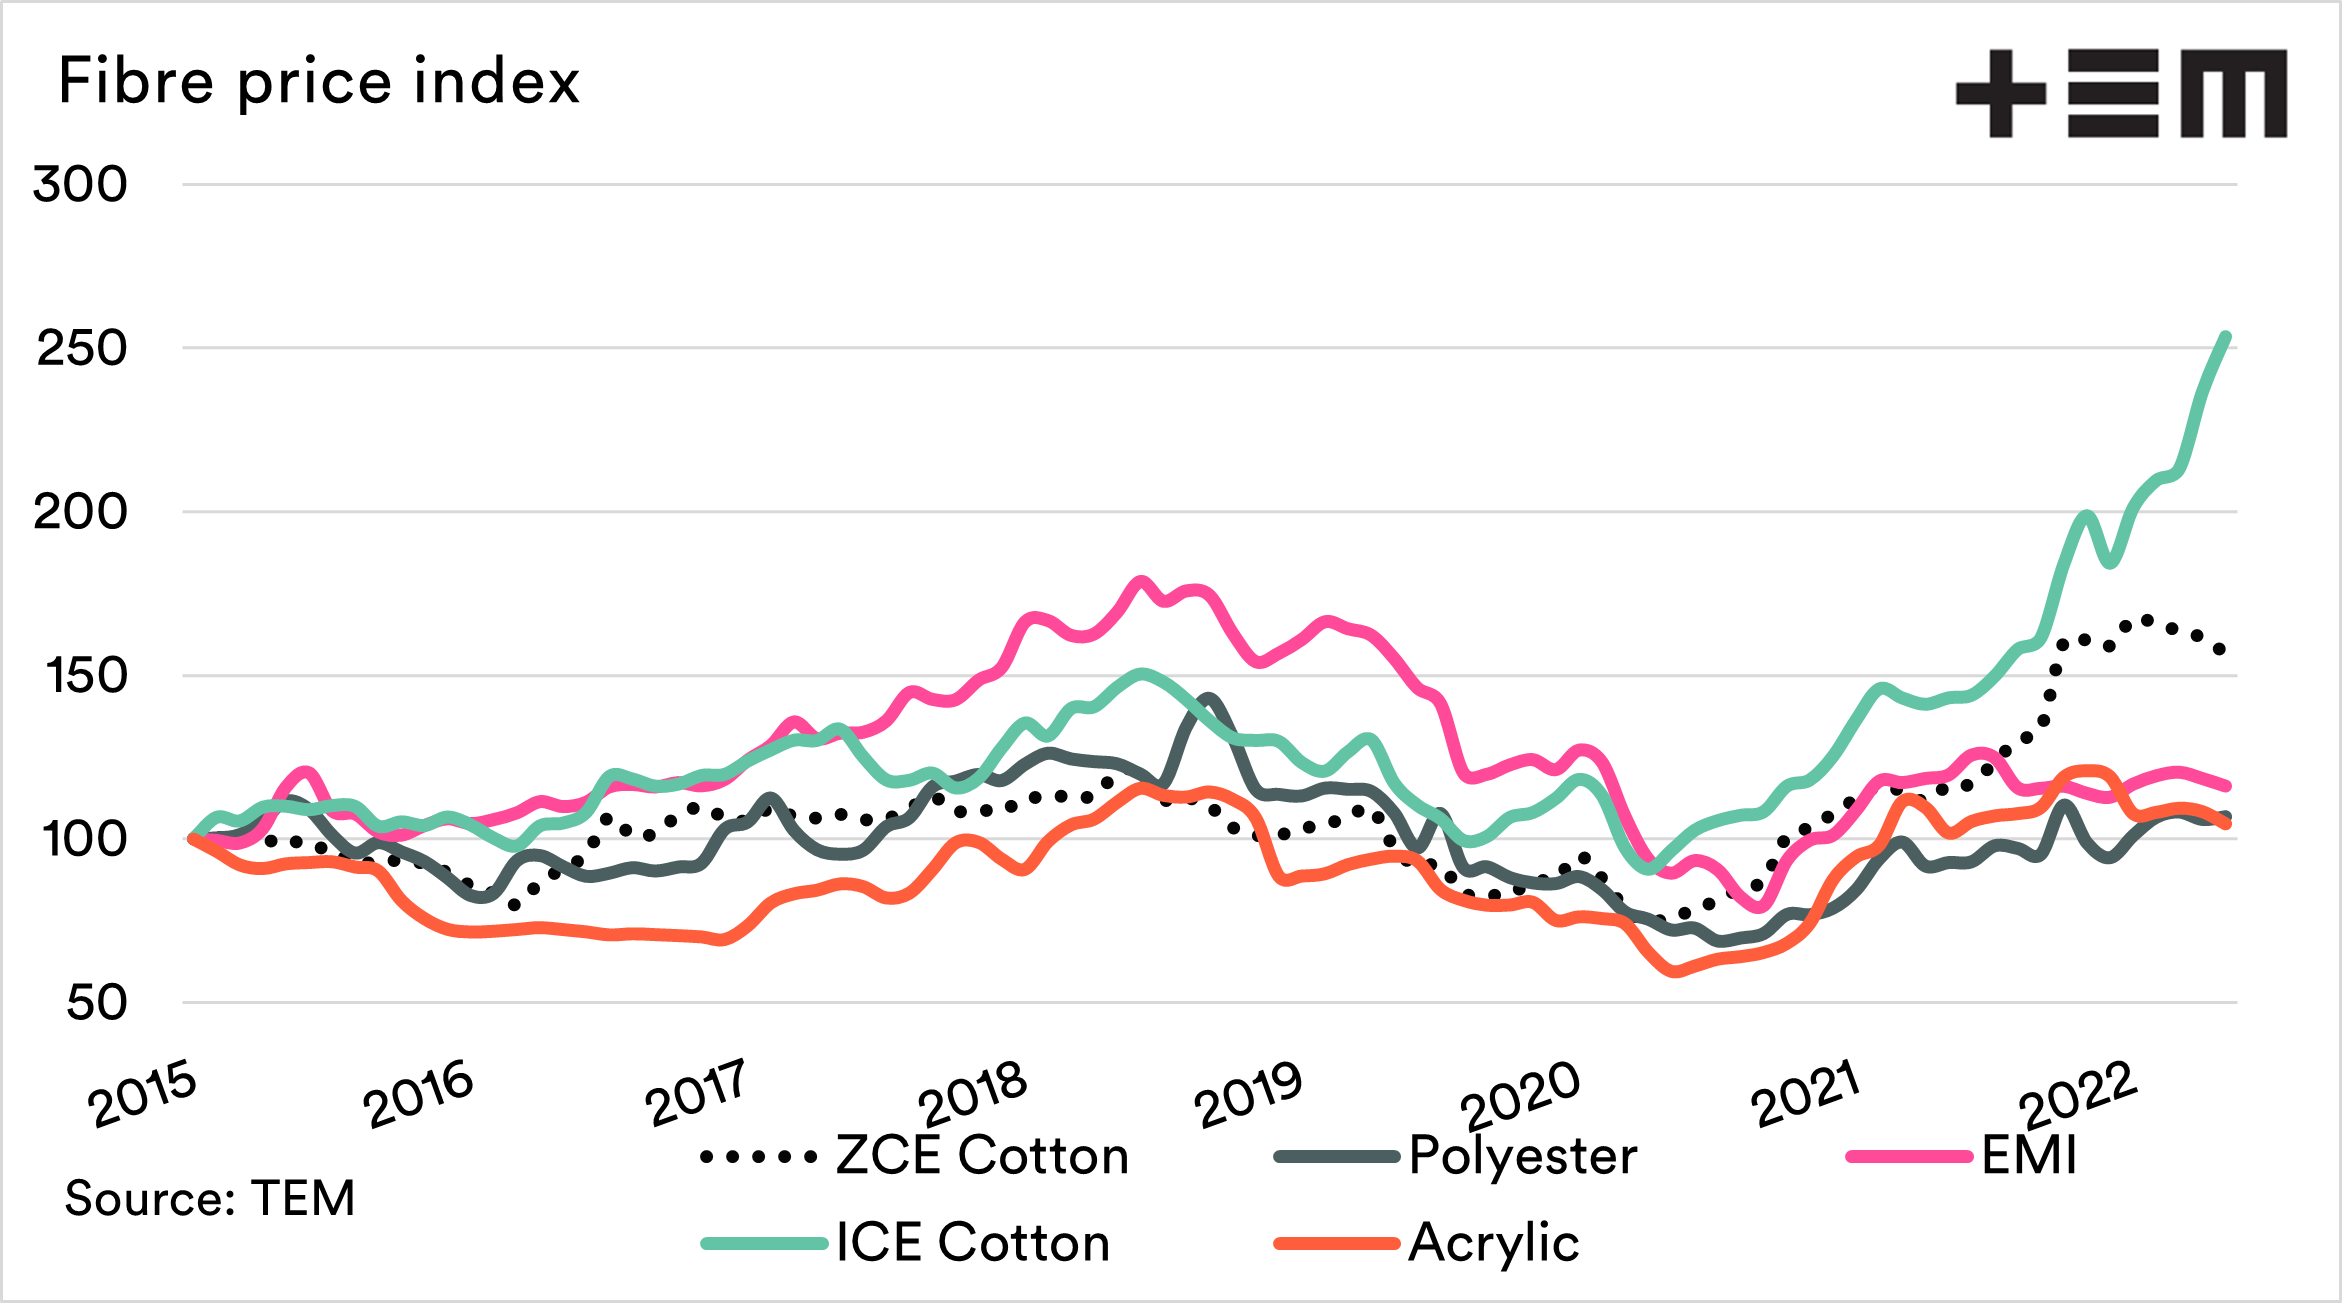
The chart below shows the following fibre types as an index, with 2015 being 100. The index’s value is that it allows the reader to quickly determine the rate of growth easily with pricing at different levels of magnitude.
- Zhengzhou cotton futures
- ICE cotton futures
- Chinese polyester & acrylic
- Eastern market indicator (wool)
Cotton has been on a massive rally in recent times. The stocks to use (STU) ratio has declined from 93% in 2019 to 67% in 2021. This means that there is a tightening in the availability compared to demand. Lower STU, corresponds with higher pricing and vice versa.
We can see that the EMI isn’t keeping up with the price of cotton. Prices recovered in 2021 after the COVID fall but have overall not really seen an uplift since then.
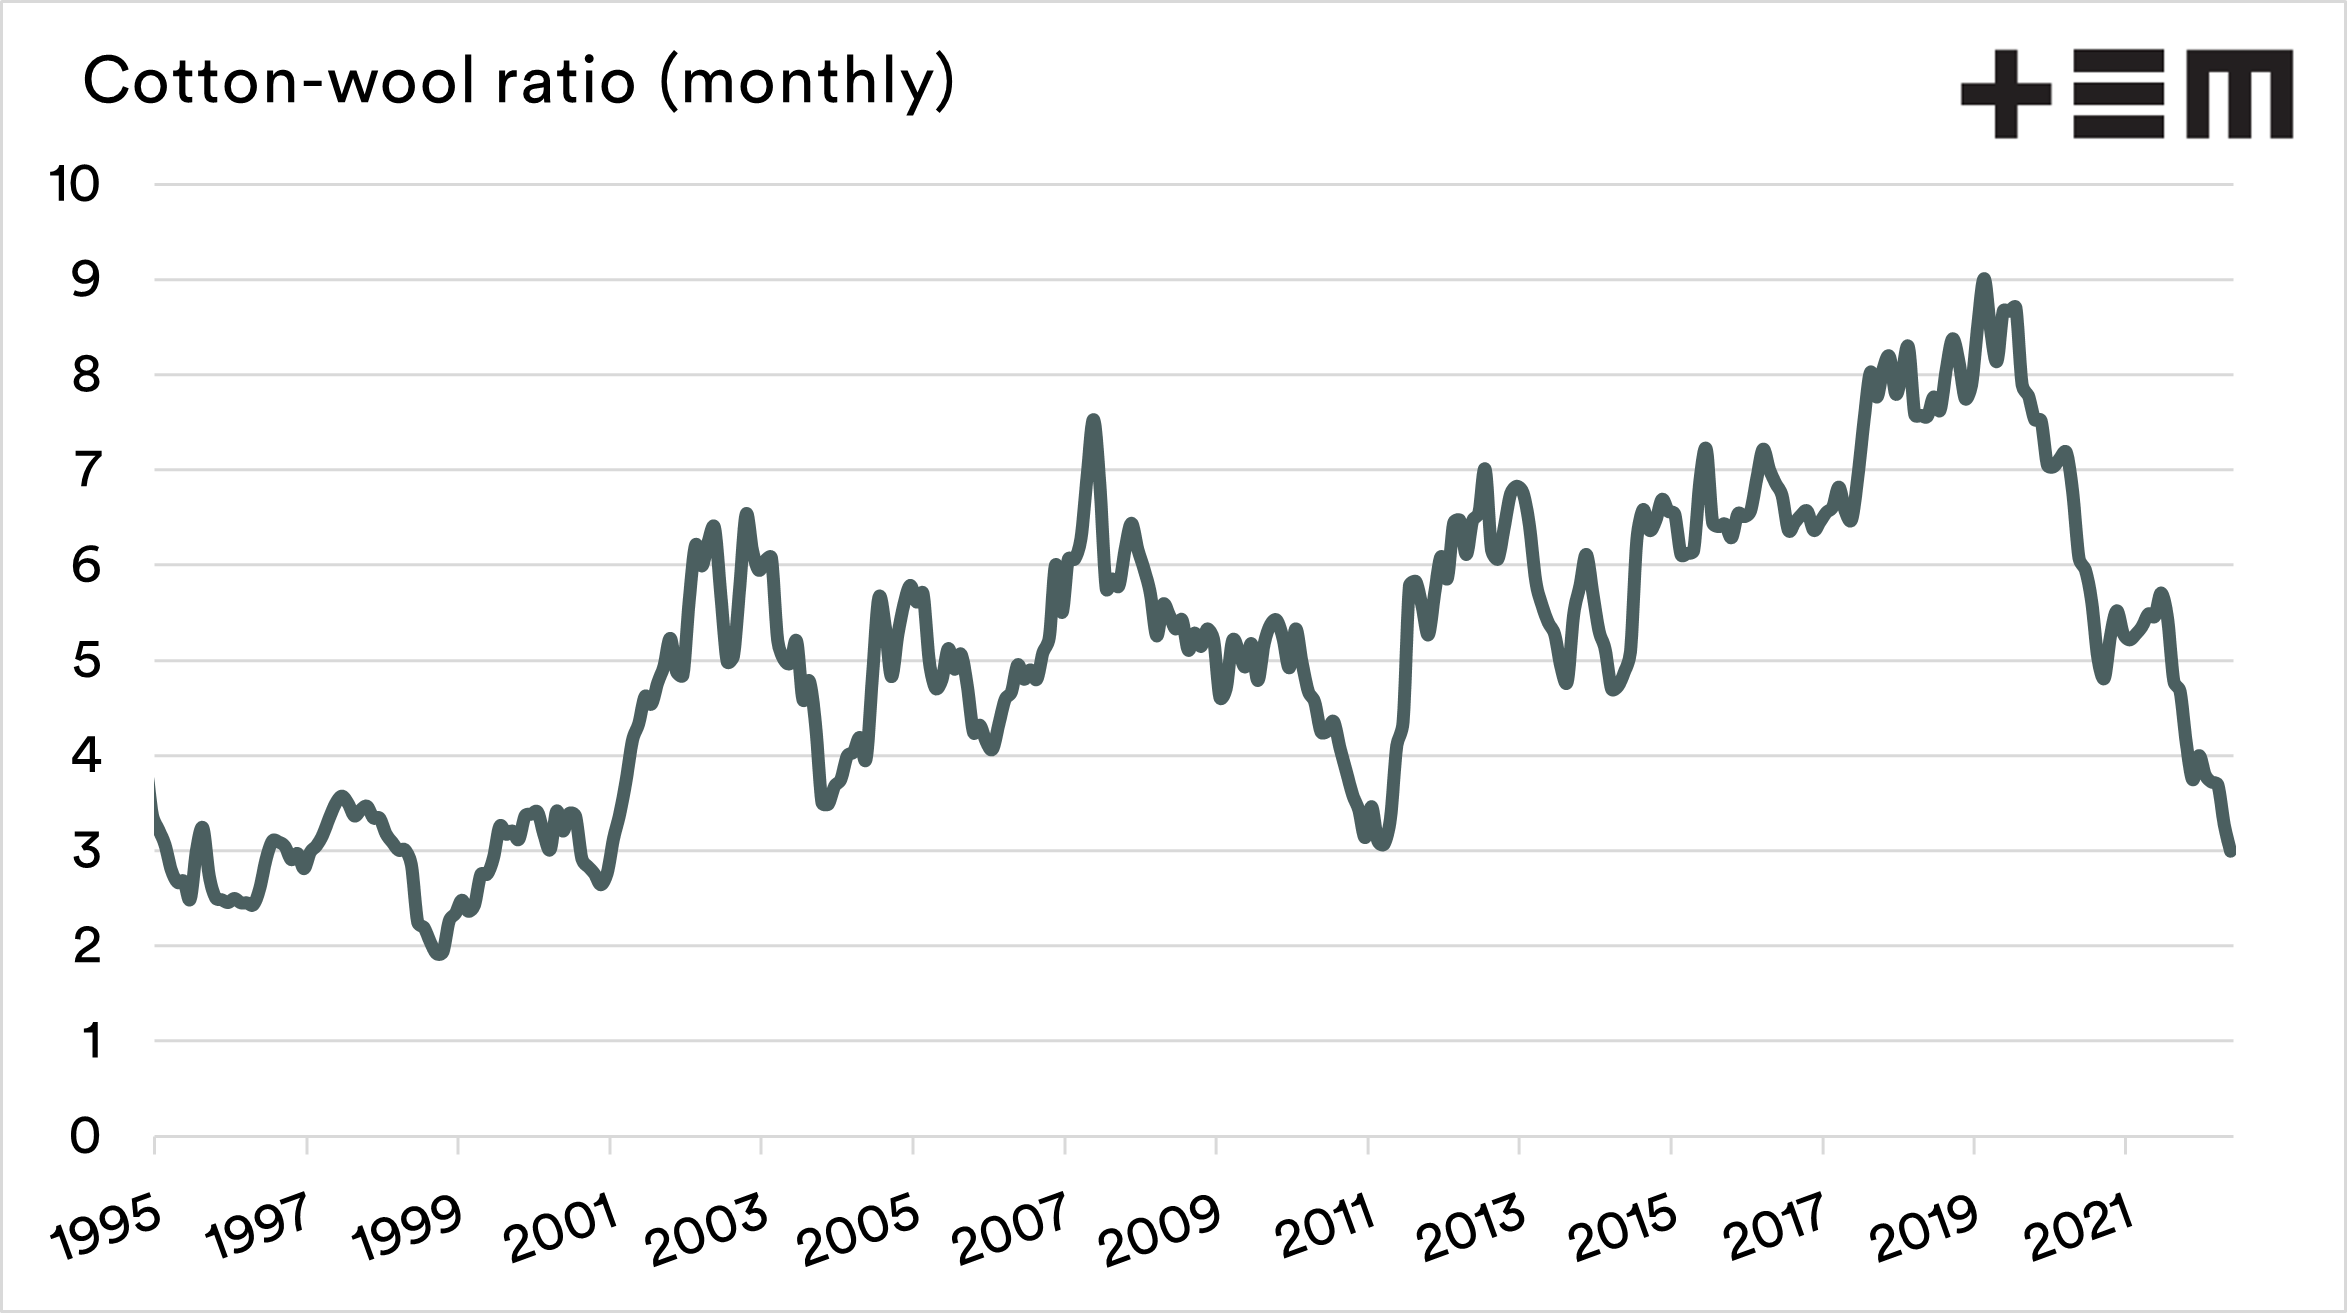
The advance in cotton and the relatively sedate EMI have seen the cotton ratio reach the lowest level in over 20 years.
There are many analysts concerned about the economic environment. Wool, and cotton to an extent, are commodities which are driven by consumer demand. If the world experiences a period of reduced growth due to financial strife, we could see a reduction in demand.
We wrote about the impact of various economic indicators on wool, including copper, crude oil and Chinese bonds.