No thanks, I’m sweet enough.
Sugar in the sweet spot
Those who look at EP3 would think that all we do is sit around and write articles on the market, but we do have to keep the lights on, and our revenue comes from advice and project work for different stakeholders within the Industry.
There are also commodities which we cover in private but not with our subscription base, mainly because the demand for this information is lower. Sugar is one of those, but I thought it would be worthwhile writing a sort piece, as I had a special request from a close friend from Tully in Northern Queensland – cane country.
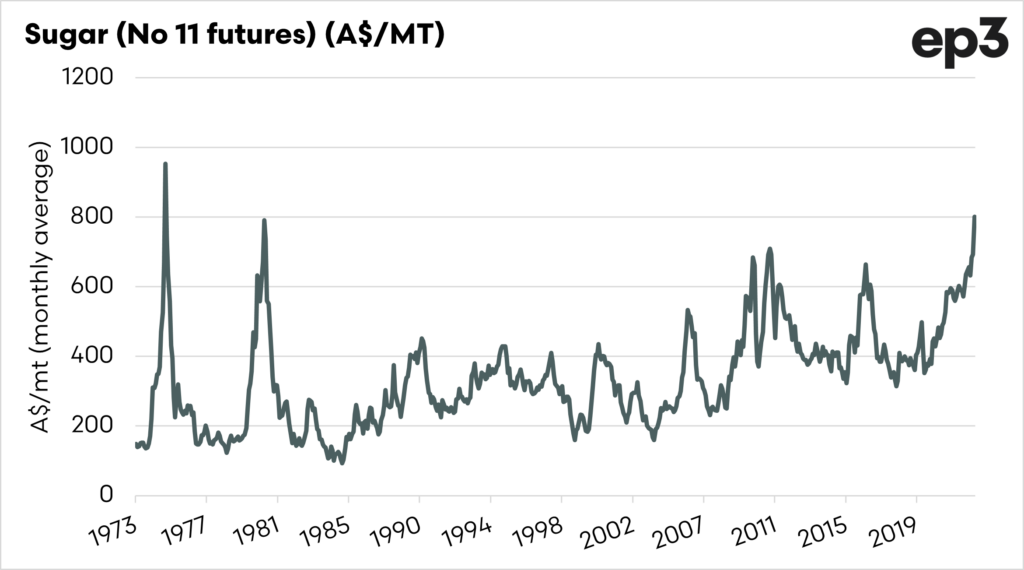
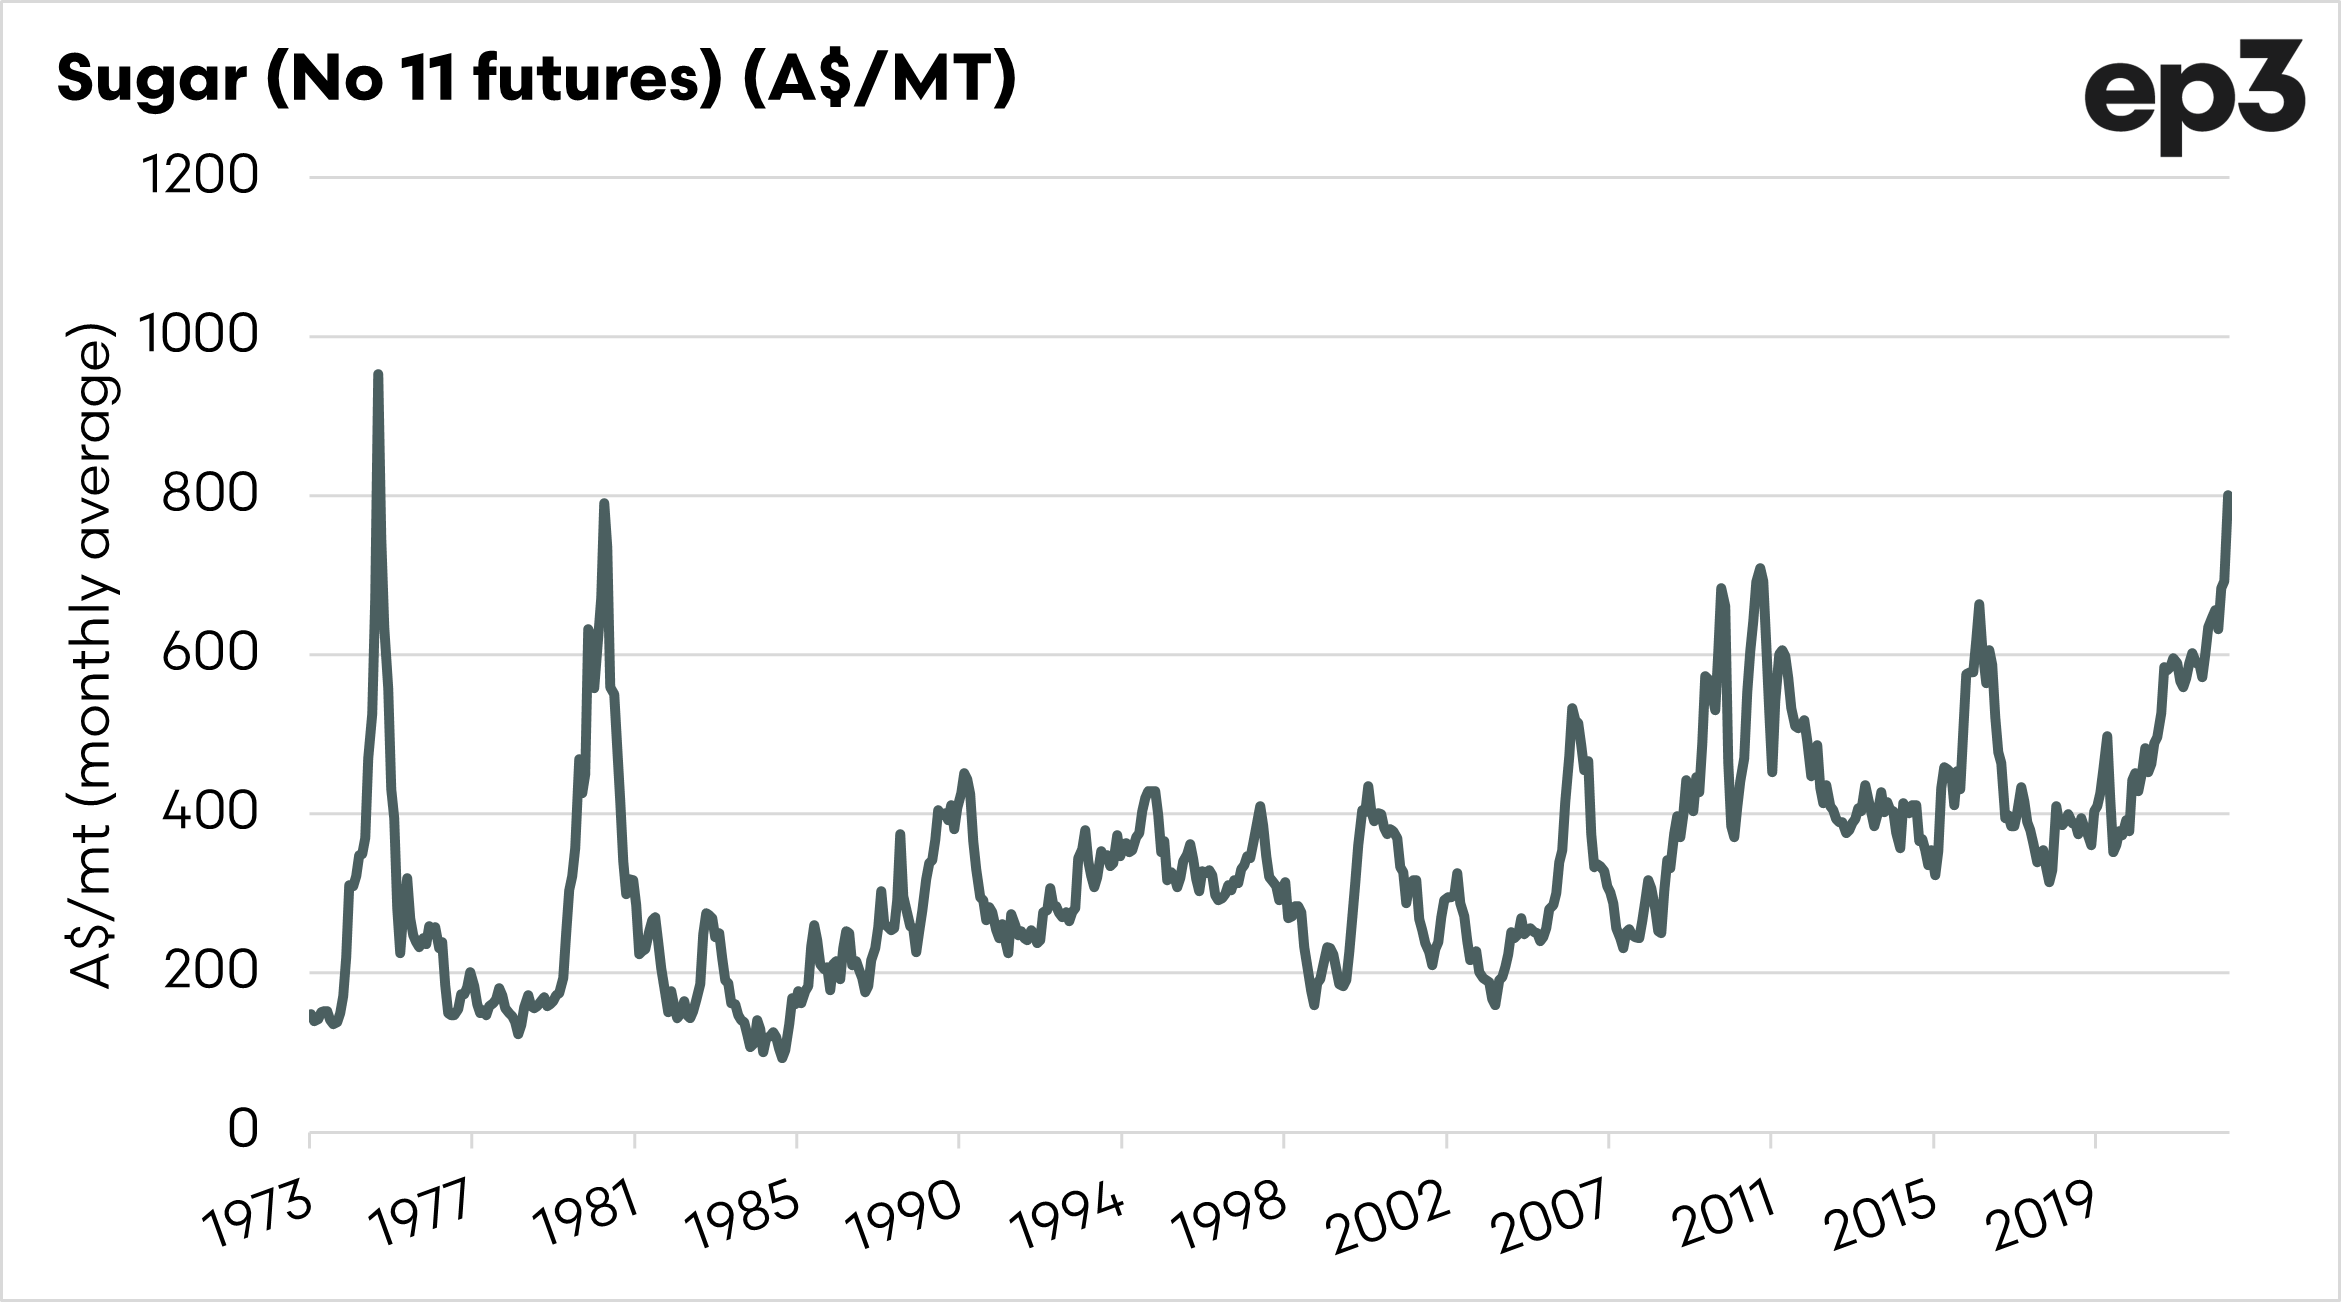
Sugar futures have been rising dramatically in recent times, which can be seen in the first chart. At the moment, sugar futures for April have averaged A$800/mt; this is the second-highest level since 1974.
There are two major reasons for the increasing sugar pricing levels:
- Rising energy prices have contributed to increased levels of sugar being used for ethanol production.
- The sugar harvest in Brazil is being hampered by wet weather.
- Indian stocks have fallen in recent year, and poor weather is hampering their production.
Energy and Sugar
We have written at length about how agricultural commodities are inherently linked with other non-agriculturla commodities including the following:
- Copper and wool
- Crude and grains
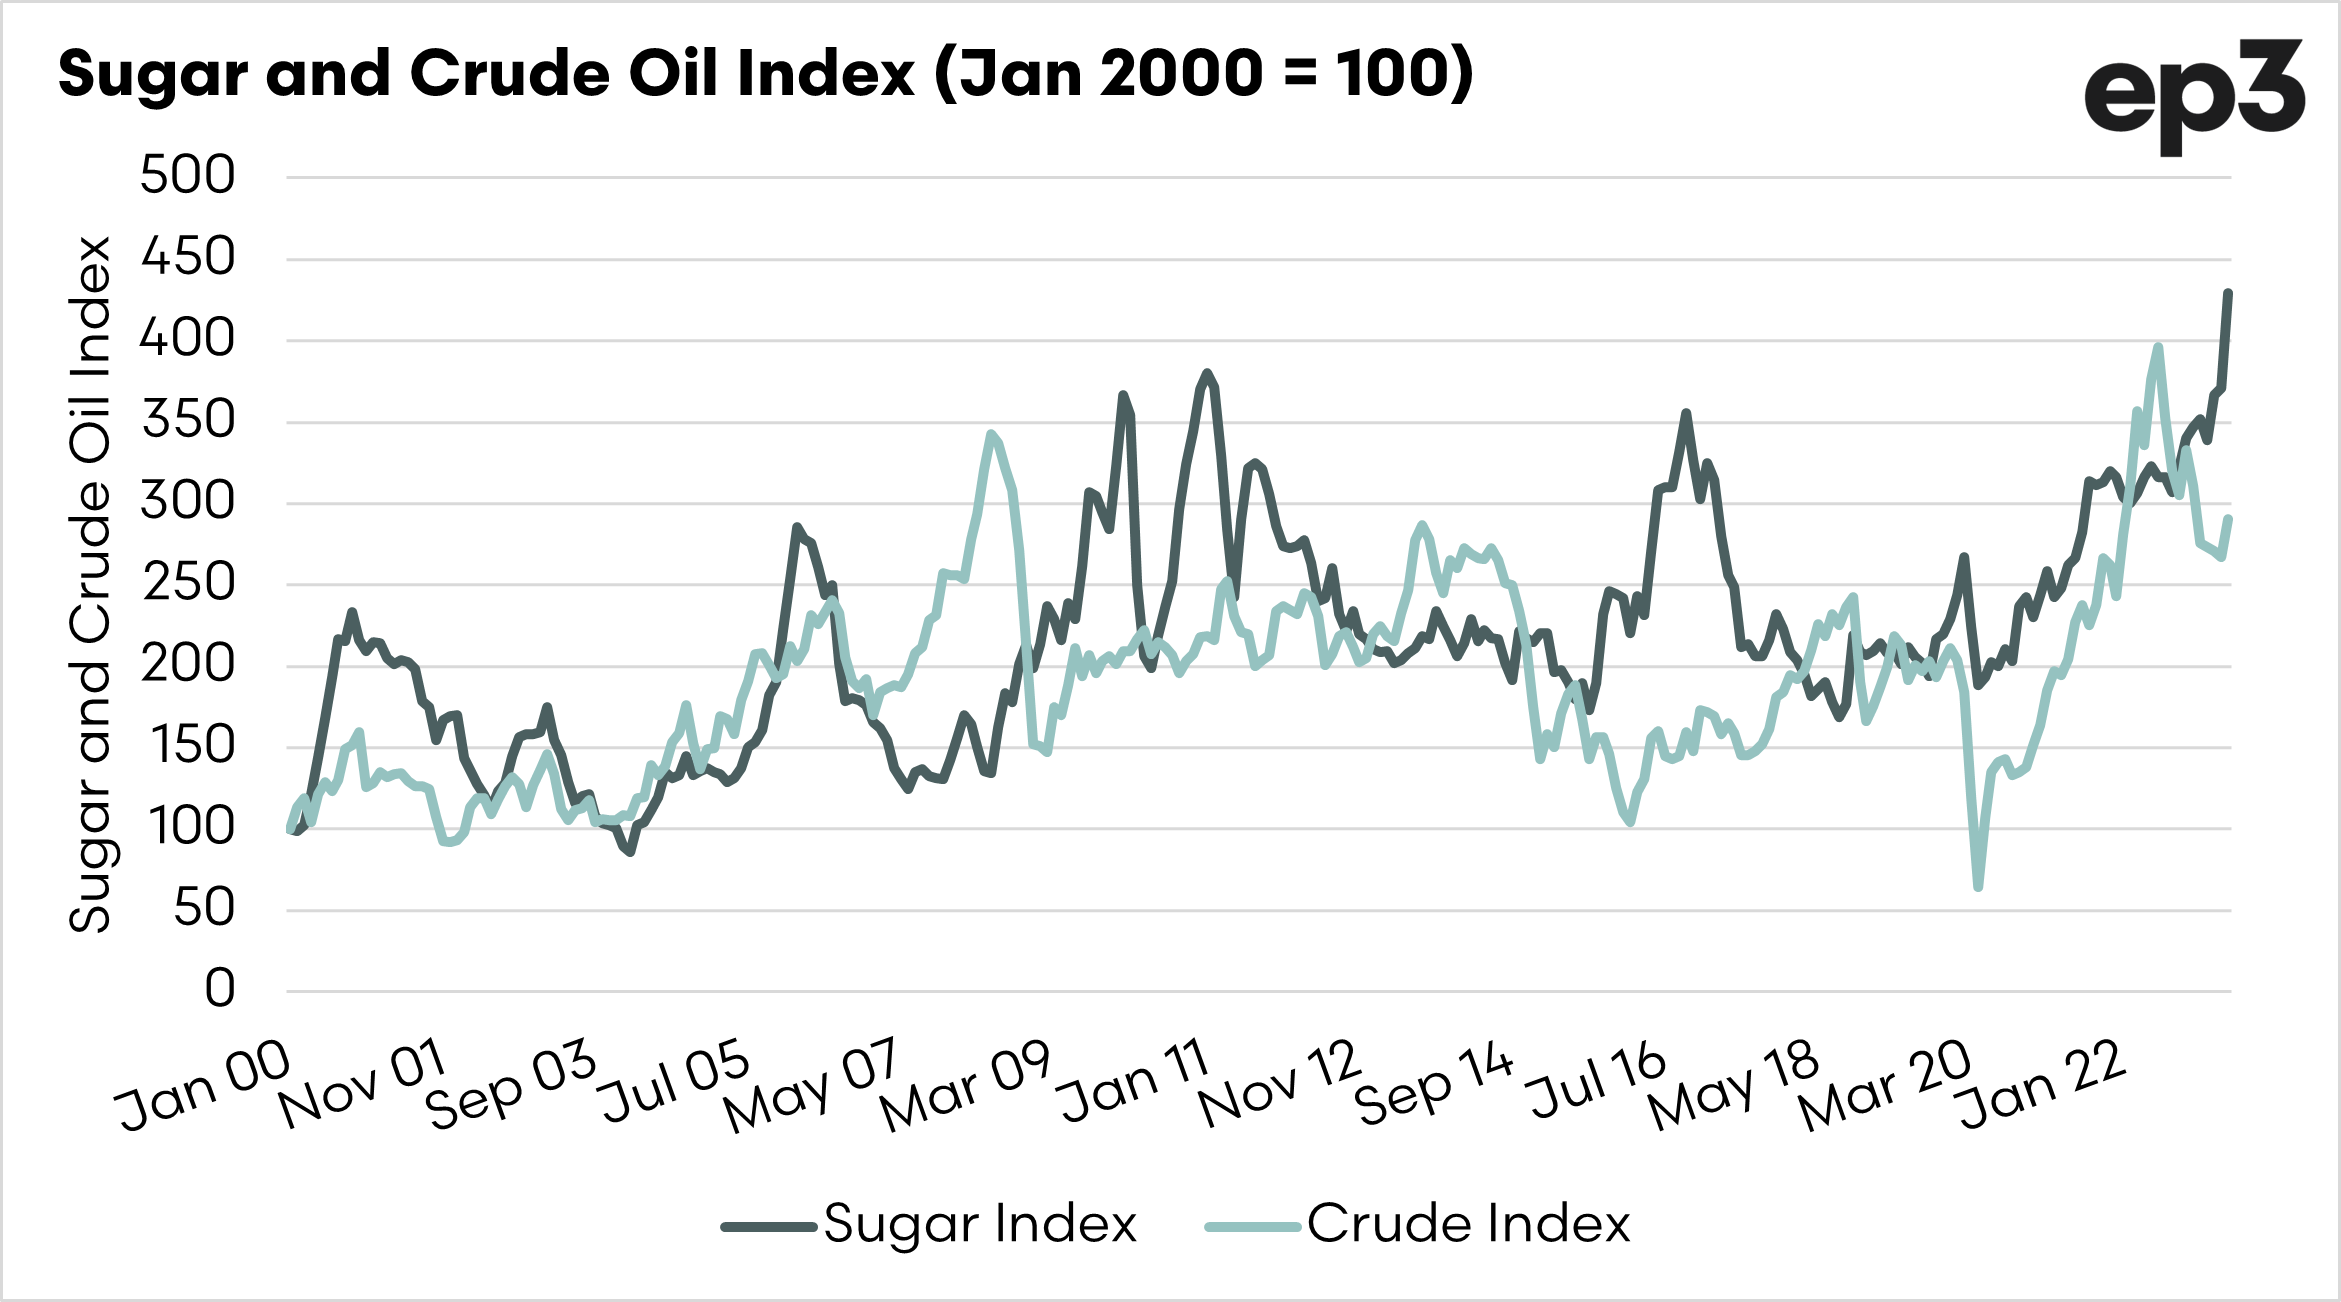
This is also the case with sugar, where large volumes can be converted to ethanol. As crude oil prices rise, then this tends to see a switch to higher inclusions of ethanol. In many parts of the world, Brazil especially, this ethanol is derived from sugarcane.
The relationship is charted below. I have converted both the futures prices to A$ terms and into an index starting in 2000. The relationship isn’t perfect but has a reasonable correlation at around 0.49 (1 being perfect, 0 being no correlation).

What do sugar farmers need to consider?
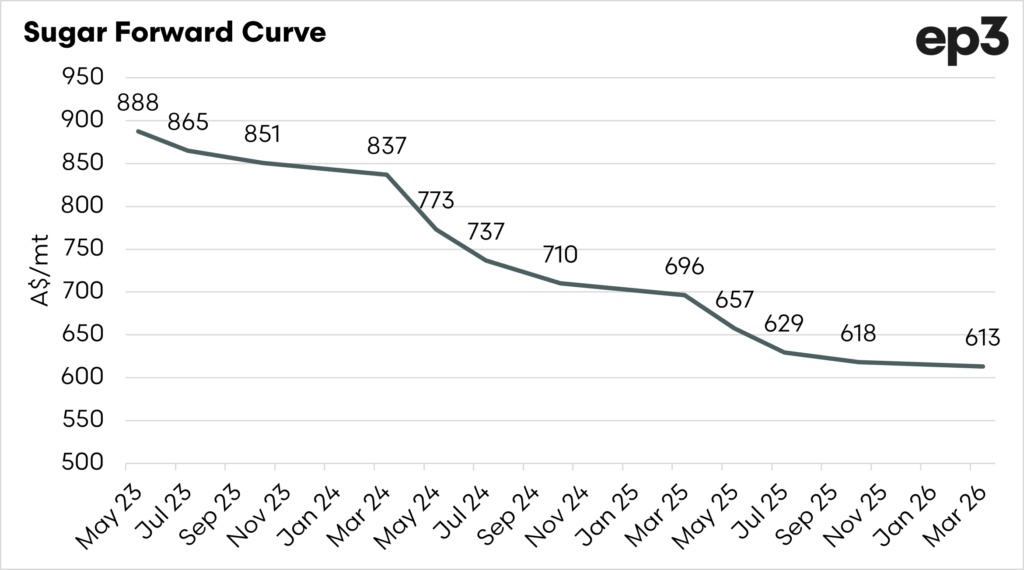
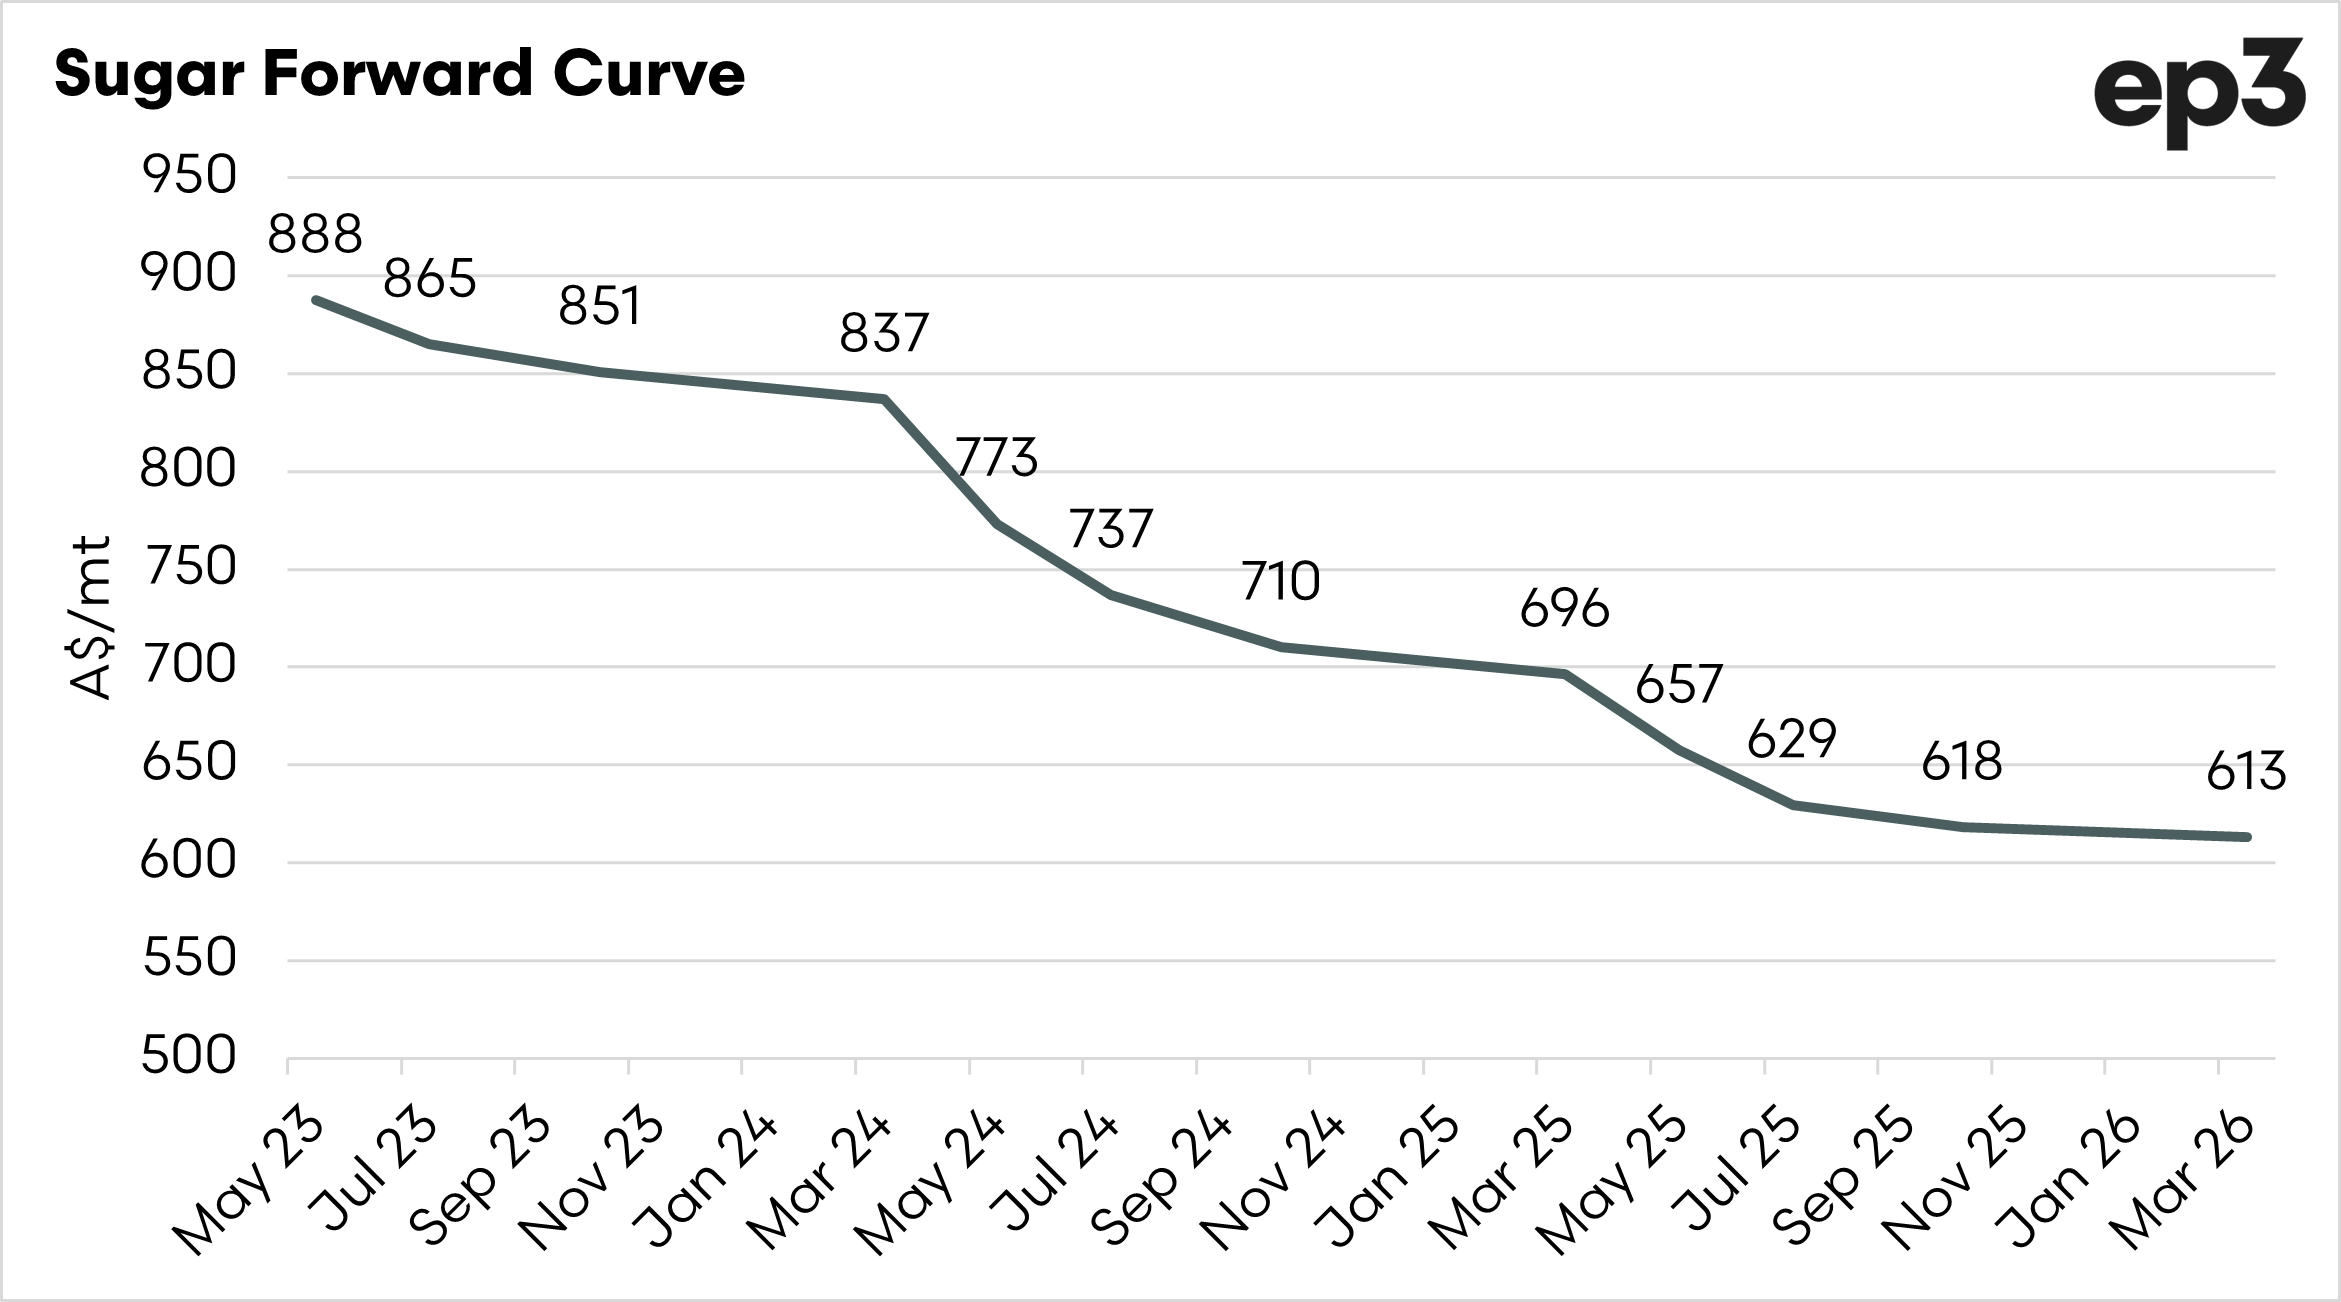
It’s going to be a tough time for consumers who don’t have hedges in place, however, there are opportunities for sugar farmers. The chart below shows the current forward curve for sugar futures (in A$/mt).
The forward curve represents the futures price at differing contractual months, in this case from May 2023 to March 2026. The market is currently in backwardation but is still providing a greater than A$600/mt price right through to the March 2026 contract, including above A$700 to the end of 2025.
To put how high these prices are, the monthly average since 2010 was A$464/mt. The closing price for the last session was A$888, a lucky number in China. This was the highest-ranked price in A$/mt terms since the turn of the century. Whilst prices may continue to rise further, I recommend that those in this space read this article ‘Oh, behaviour‘, as markets don’t continue to rise forever. Remember the old staying: The cure for low prices is low prices, and the cure for high prices is high prices.
Whilst we don’t provide advice on this website, the values on offer at attractive, and many should consider their spot and forward pricing for sugar.
Explanation of Contango and Backwardation
Contango:
A forward curve is in contango when the forward futures months are at a premium to the spot level. In the above chart, the market is in contango, as each of the months ahead is higher than the September contract.
The futures market in contango is effectively paying a premium for the seller to carry the crop.
Backwardation:
As you might expect, backwardation is the opposite of contango. The forward curve is in backwardation when the forward market is trading at a discount to the spot market.
When in backwardation, the market is effectively wanting access to grain as soon as possible and does not want to pay you to carry the grain